Section author: Rebecca Vederhus, Sebastian Jentschke
From SPSS to jamovi: Non-parametric analyses
This comparison shows how a Mann-Whitney test is conducted in SPSS and jamovi. The SPSS test follows the description in chapter 7.4.3 in Field (2017), especially figure 7.6 - 7.8 and output 7.2. It uses the data set Drug.sav which can be downloaded from the web page accompanying the book.
SPSS |
jamovi |
|---|---|
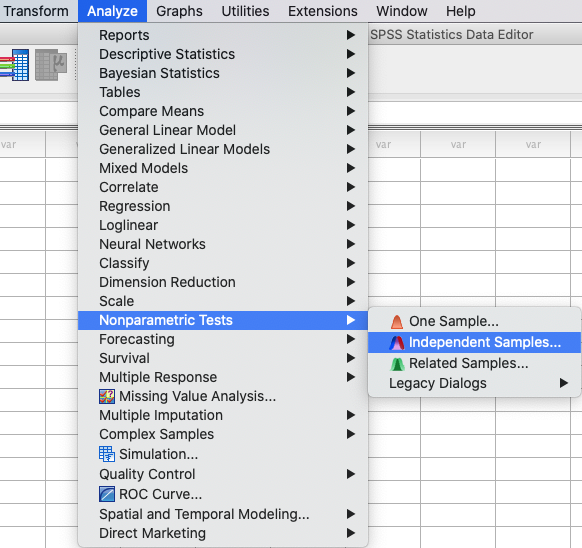
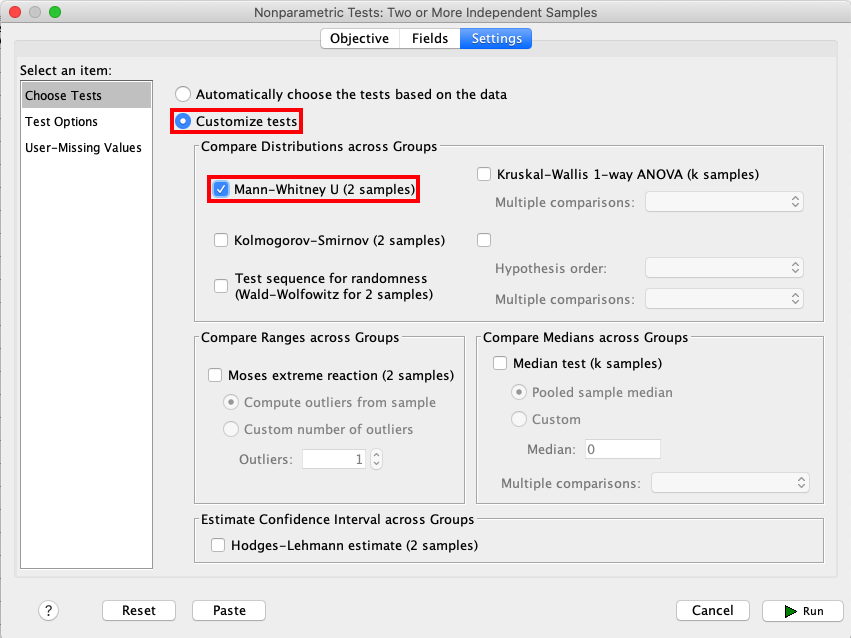
In SPSS, a Mann-Whitney test can be run using: |
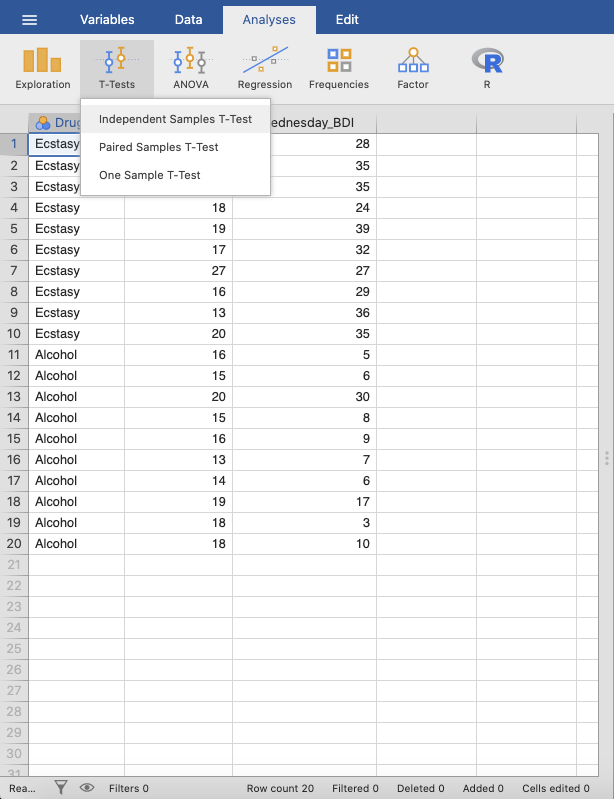
In jamovi this is done using the following steps: |
|
|
In SPSS, choose |
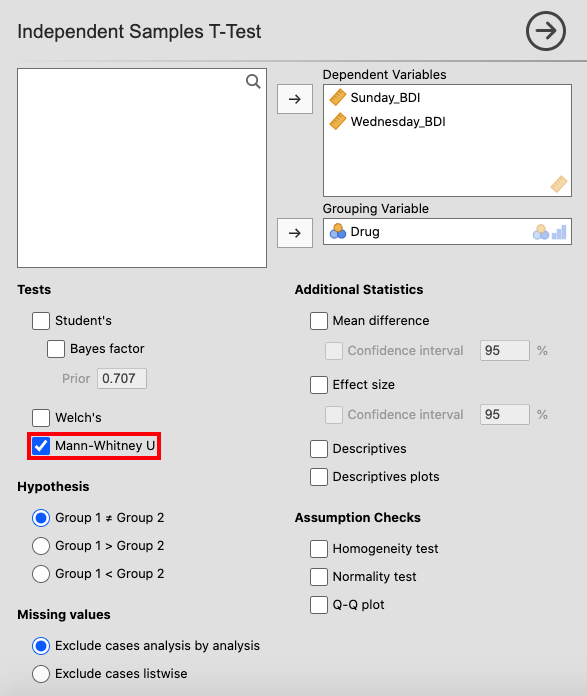
In jamovi, move |
|
|
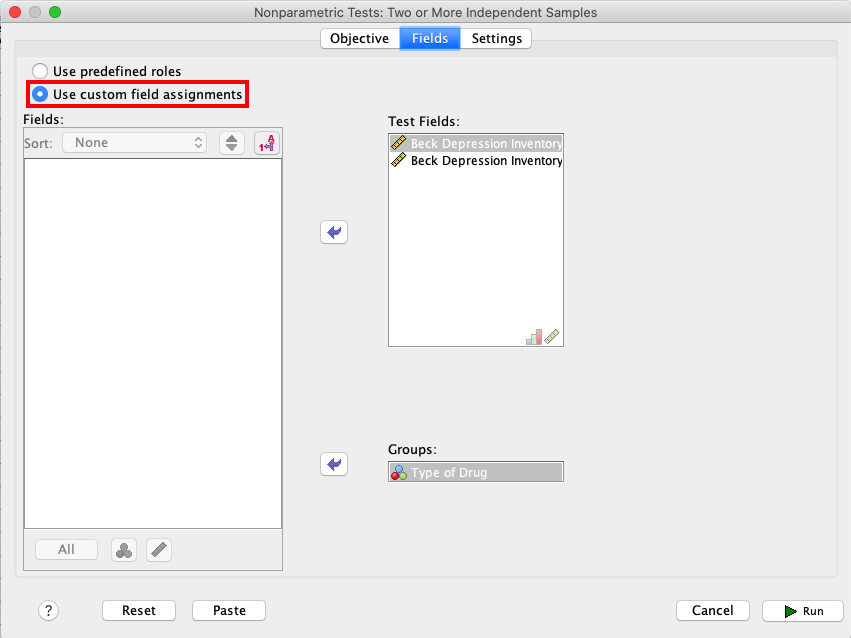
Open the |
|
|
|
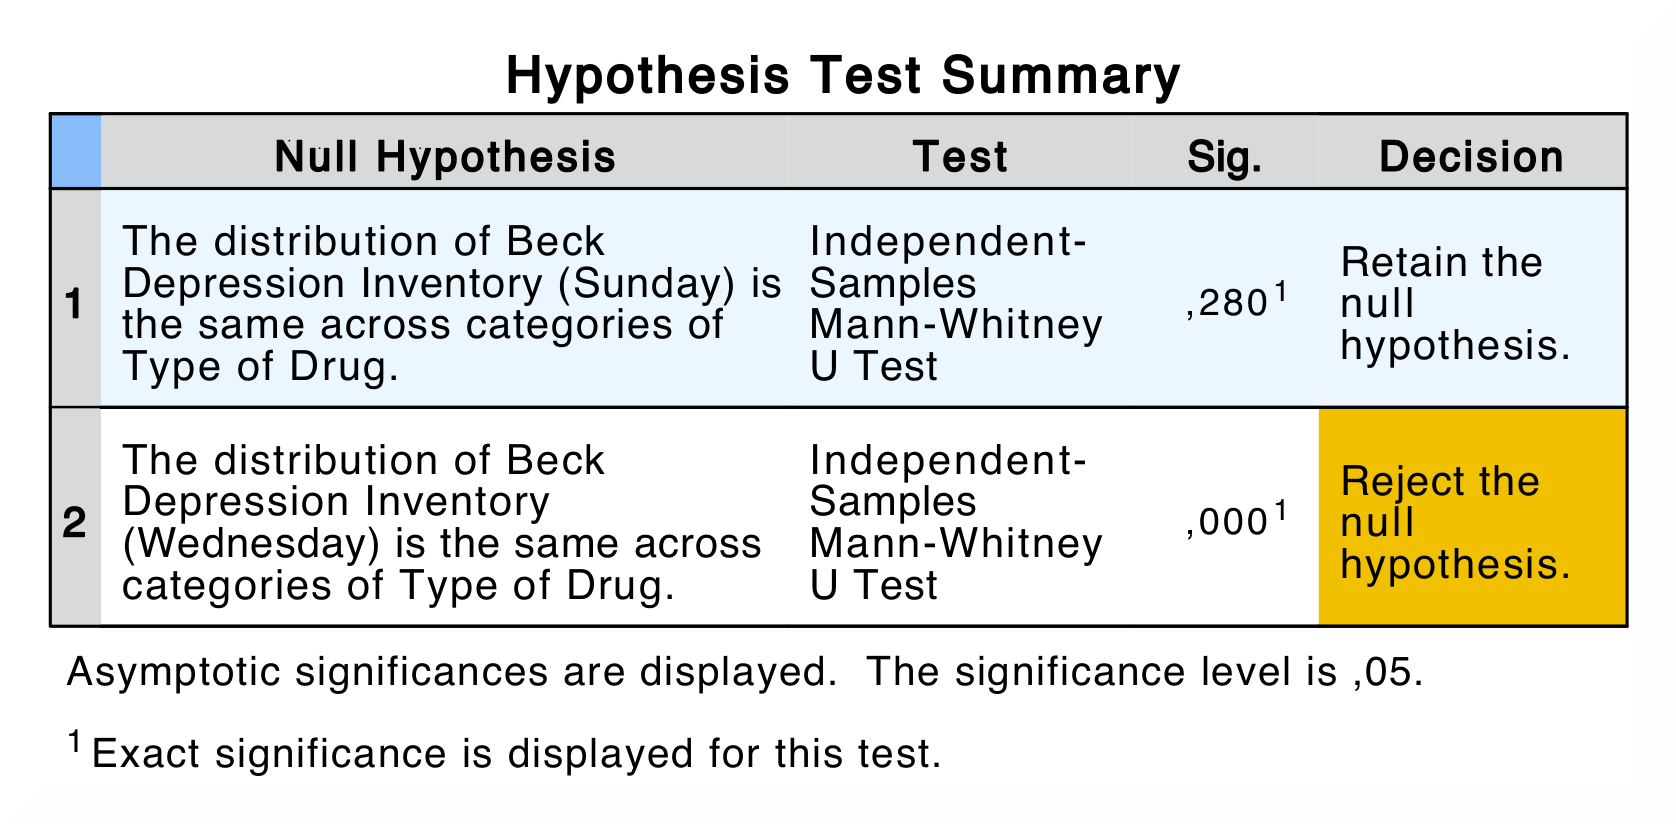
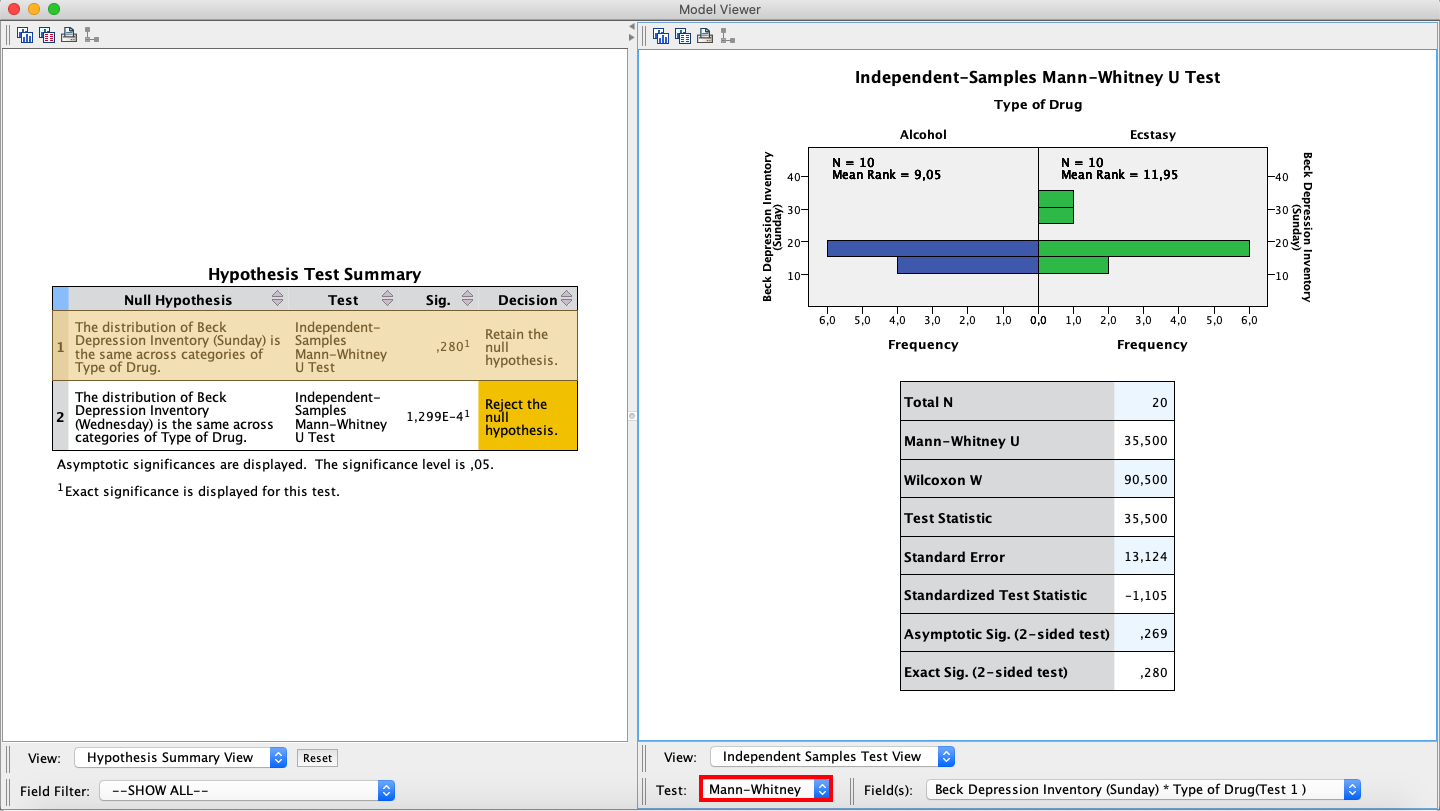
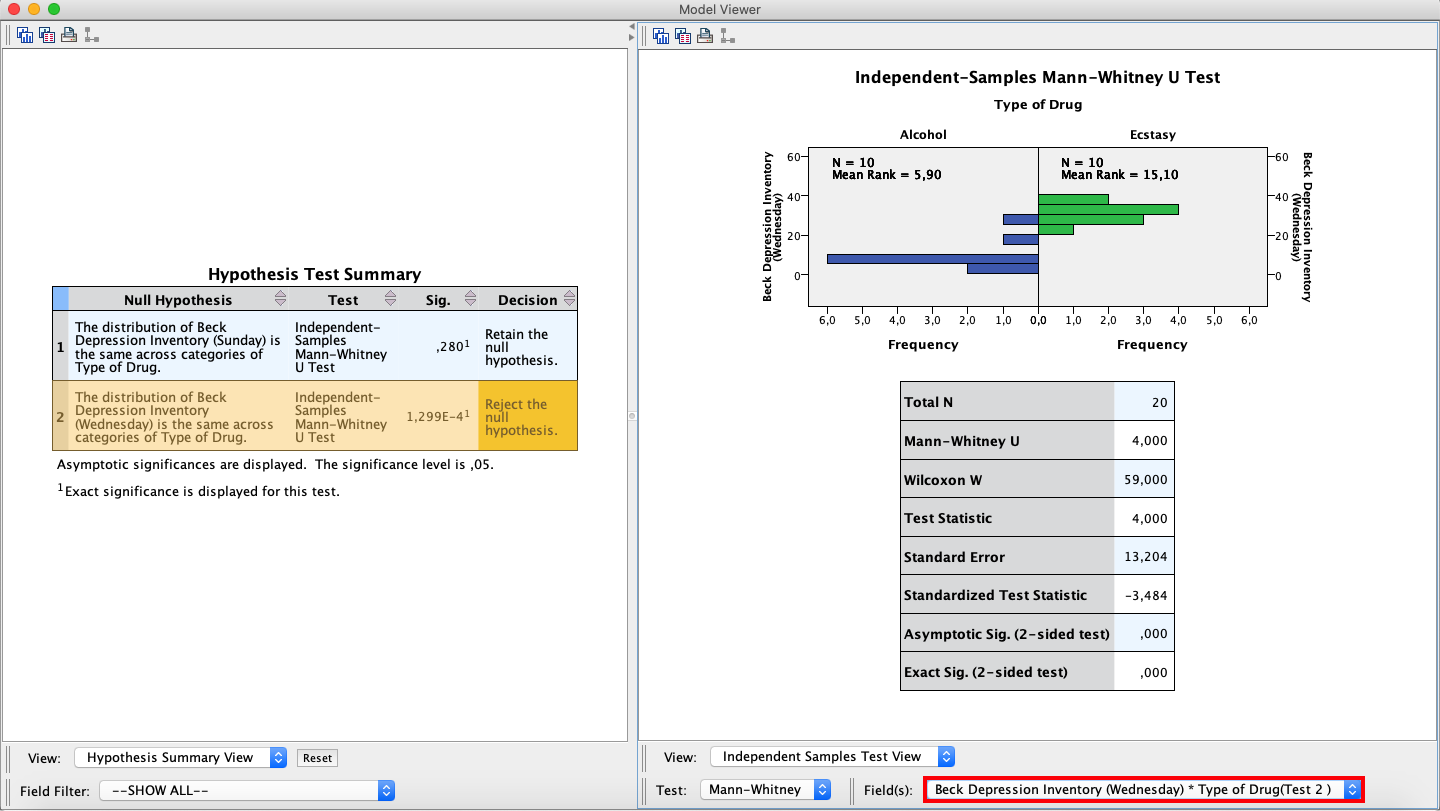
By comparing the output from SPSS and jamovi, you can tell that some of the results are the same. The results in jamovi are presented in a single table, while in SPSS you have to double-click the table in order to get the rest of the results. |
|
|
|
In SPSS, the first table is the |
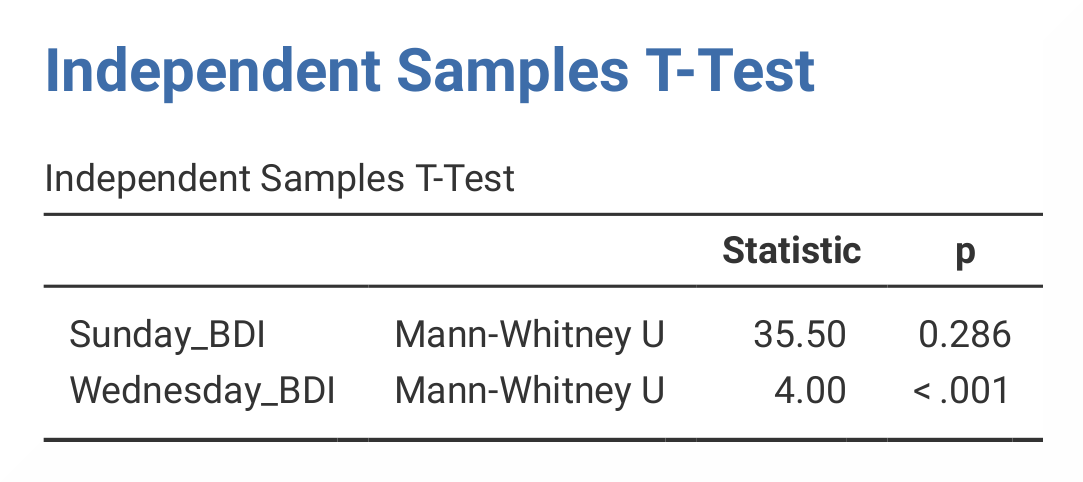
In jamovi, results are presented in the |
The output in jamovi only presents the Mann-Whitney U statistic and its significance value, while SPSS presents values for The numerical values for the Wednesday group are the same in SPSS and jamovi (U = 4.00, p < .001), while the values for the Sunday group differ slightly (U = 35.50, p = .280 vs. p = .286). The reason for the difference is that jamovi applies continuity correction (where a discrete distribution – ranks – is approximated via a continuous one – the standard normal distribution) whereas SPSS doesn’t. |
|
If you wish to replicate those analyses using syntax, you can use the commands below (in jamovi, just copy to code below to Rj). Alternatively, you can download the SPSS output files and the jamovi files with the analyses from below the syntax. |
|
NPTESTS
  /INDEPENDENT TEST (Sunday_BDI Wednesday_BDI) GROUP (Drug) MANN_WHITNEY
  /MISSING SCOPE=ANALYSIS USERMISSING=EXCLUDE
  /CRITERIA ALPHA=0.05 CILEVEL=95.
|
jmv::ttestIS(
    formula = Sunday_BDI + Wednesday_BDI ~ Drug,
    data = data,
    students = FALSE,
    mann = TRUE)
|