Section author: Sebastian Jentschke
From SPSS to jamovi: t-test for independent samples
This comparison shows how a t-test for independent samples is performed in SPSS and jamovi. How the test is conducted in SPSS follows the description in chapter 10.8 of Field (2017), especially Figure 10.4 and Output 10.3 - 10.4. It uses the data set Invisibility.sav which can be downloaded from the web page accompanying the book.
SPSS |
jamovi |
|---|---|
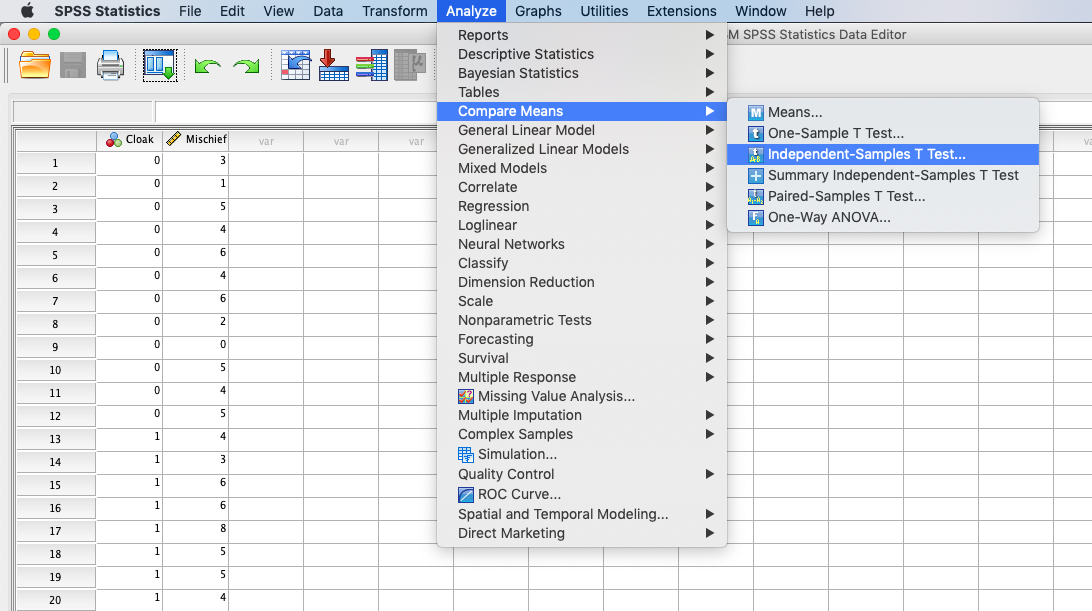
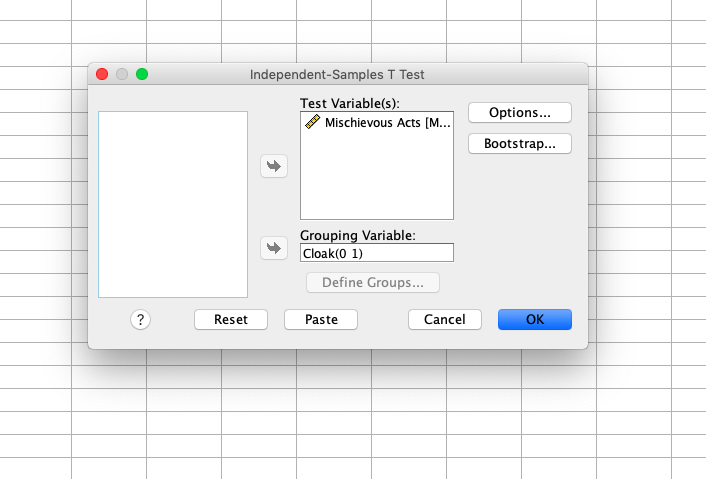
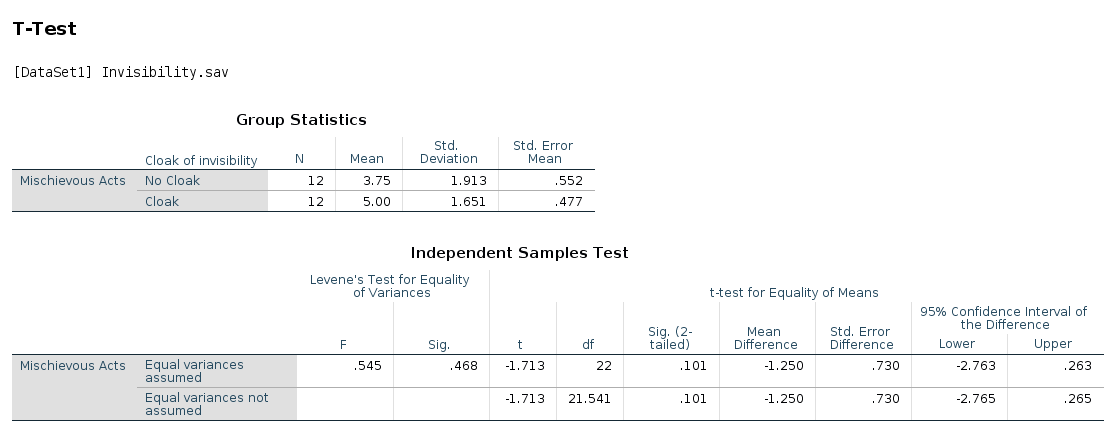
In SPSS you can run an independent t-test using: |
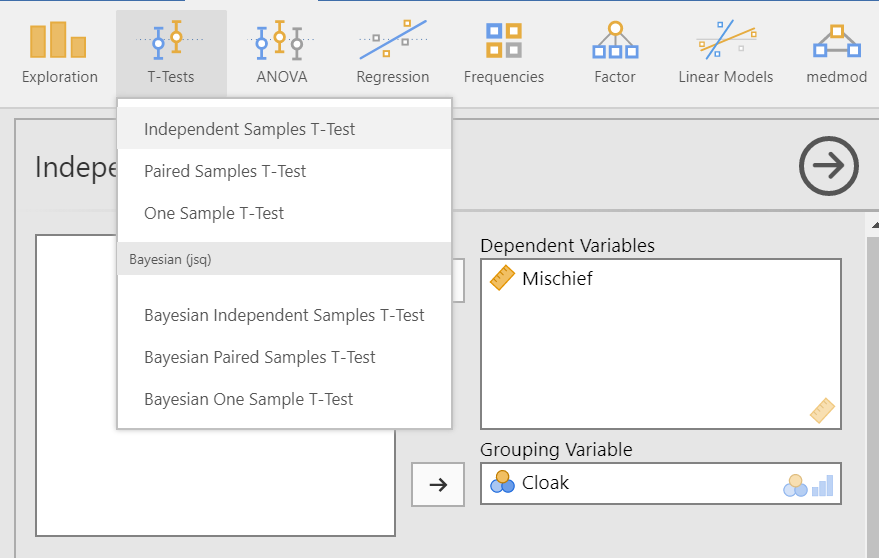
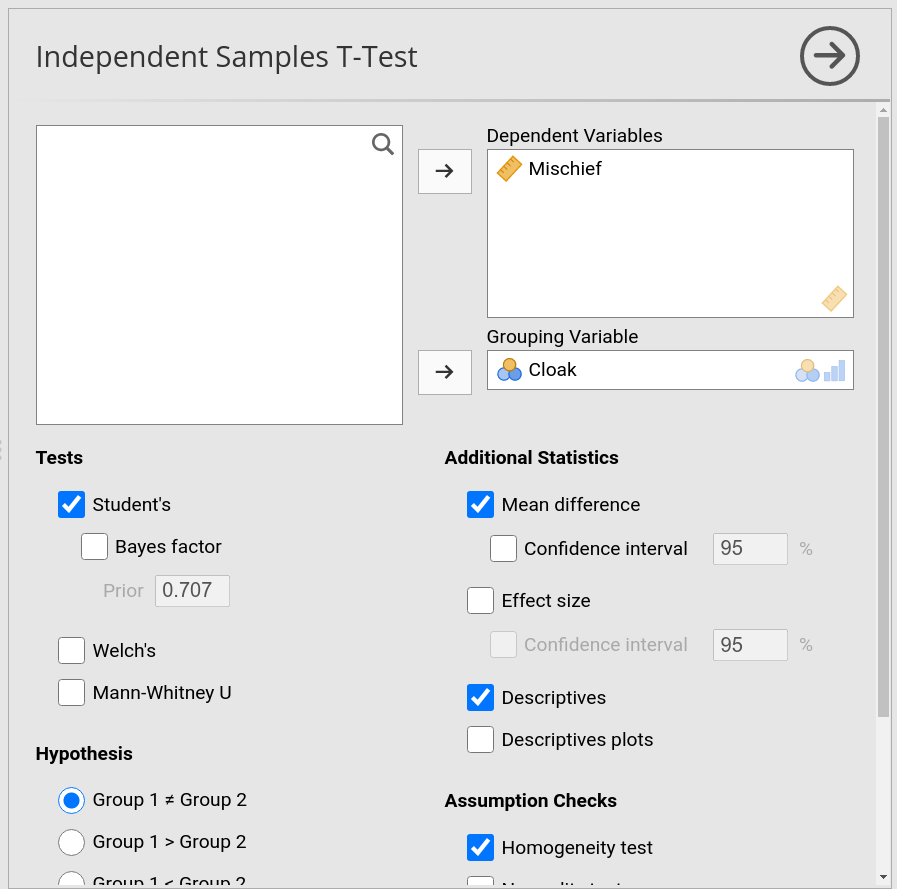
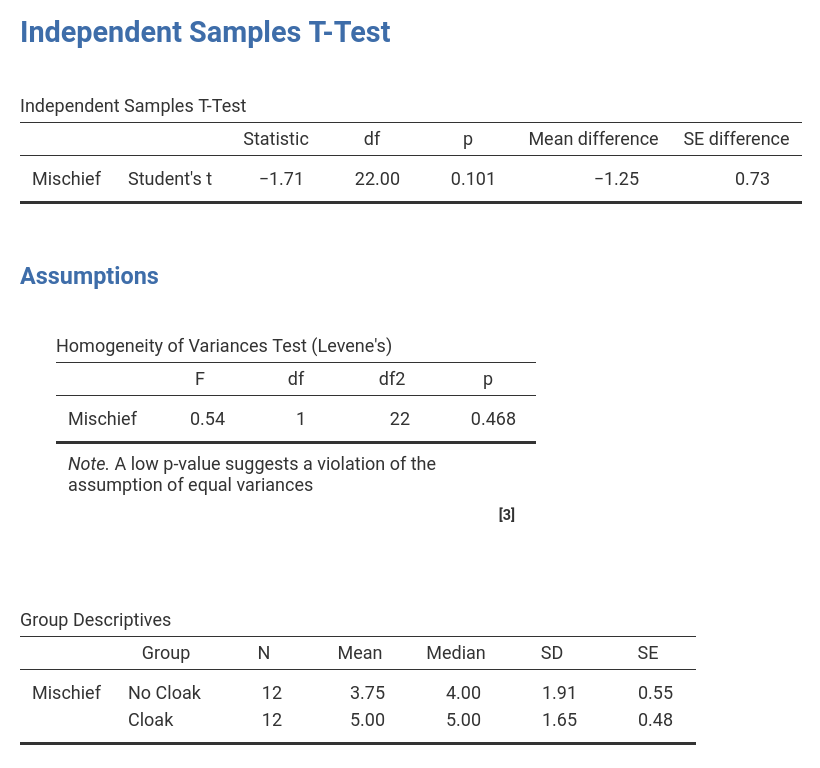
In jamovi you do this using: |
|
|
In SPSS, |
In jamovi, the variable |
|
|
If one compares the outputs of SPSS and jamovi, the results are the same. However, the output of jamovi appears much clearer. The main results can be found in slightly different places in SPSS and jamovi. |
|
|
|
In SPSS, the output table |
If the p-value in the table |
The t-value can be found in the third column ( The numerical values for the statistics are identical: t = -1.71, df = 22, p = 0.101. |
|
If you wish to replicate those analyses using syntax, you can use the commands below (in jamovi, just copy to code below to Rj). Alternatively, you can download the SPSS output files and the jamovi files with the analyses from below the syntax. |
|
T-TEST GROUPS=Cloak(0 1)
   /VARIABLES=Mischief
   /CRITERIA=CI(.95)
   /MISSING=ANALYSIS.
|
jmv::ttestIS(
    data = data,
    formula = Mischief ~ Cloak,
    desc = TRUE,
    eqv = TRUE)
|