Section author: Rebecca Vederhus, Sebastian Jentschke
From SPSS to jamovi: Analysis of Covariance (ANCOVA)
This comparison shows how a regression with one predictor and two dummy variables is performed in SPSS and jamovi. The SPSS test follows the description in chapter 13.3 of Field (2017), especially Output 13.1 - 13.2. It uses the data set Puppy Love Dummy.sav which can be downloaded from the web page accompanying the book.
SPSS |
jamovi |
|---|---|
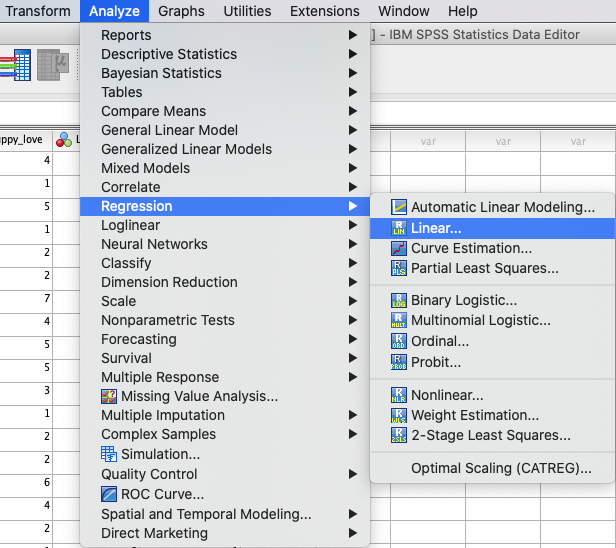
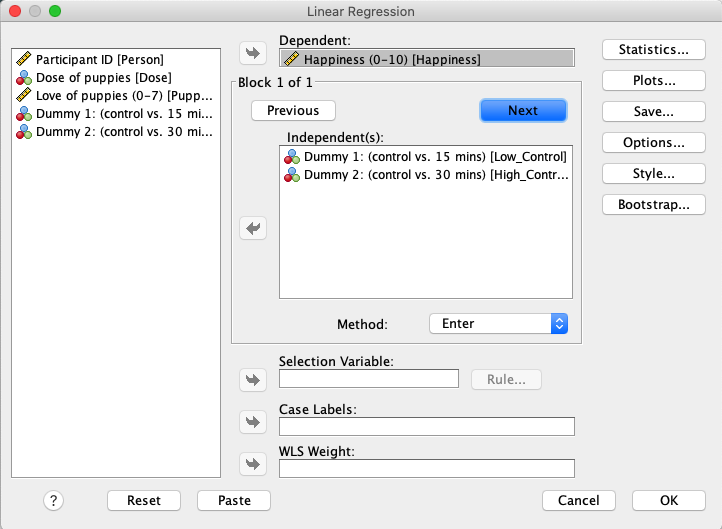
In SPSS you can run a regression using: |
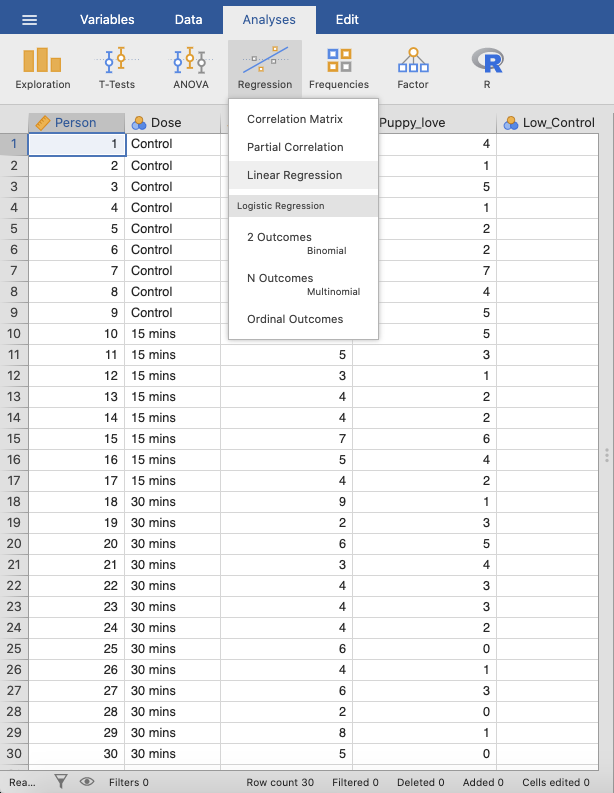
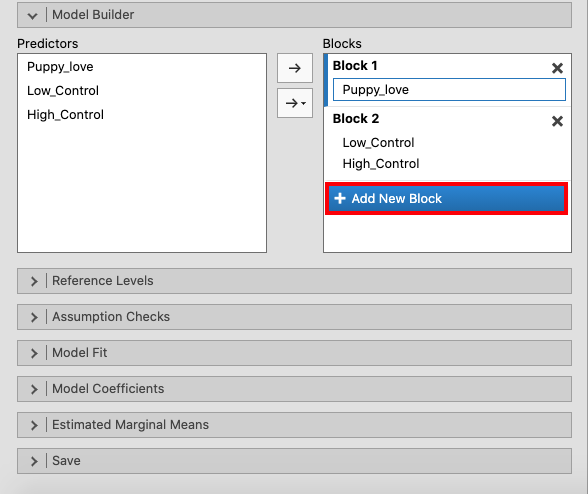
In jamovi you do this using: |
|
|
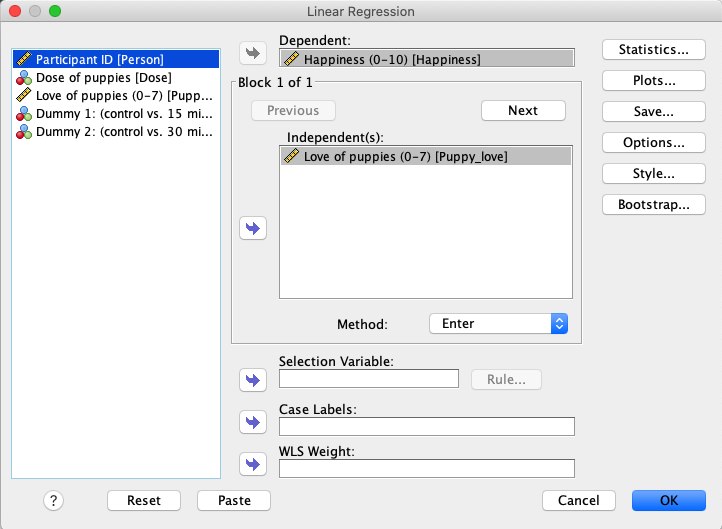
In SPSS, move |
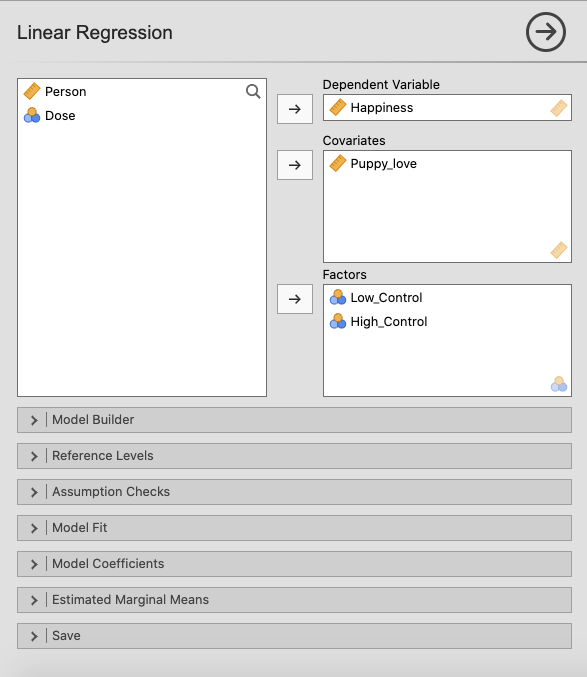
In jamovi, move |
|
|
Press the |
Create a new block of independent variables using |
|
|
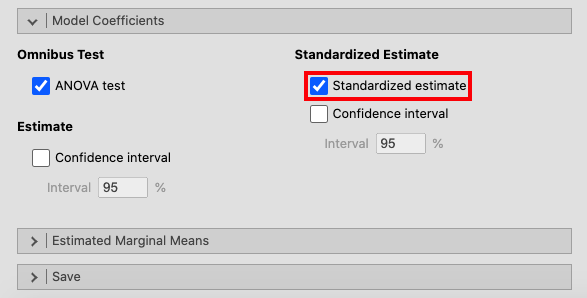
Open the |
|
|
|
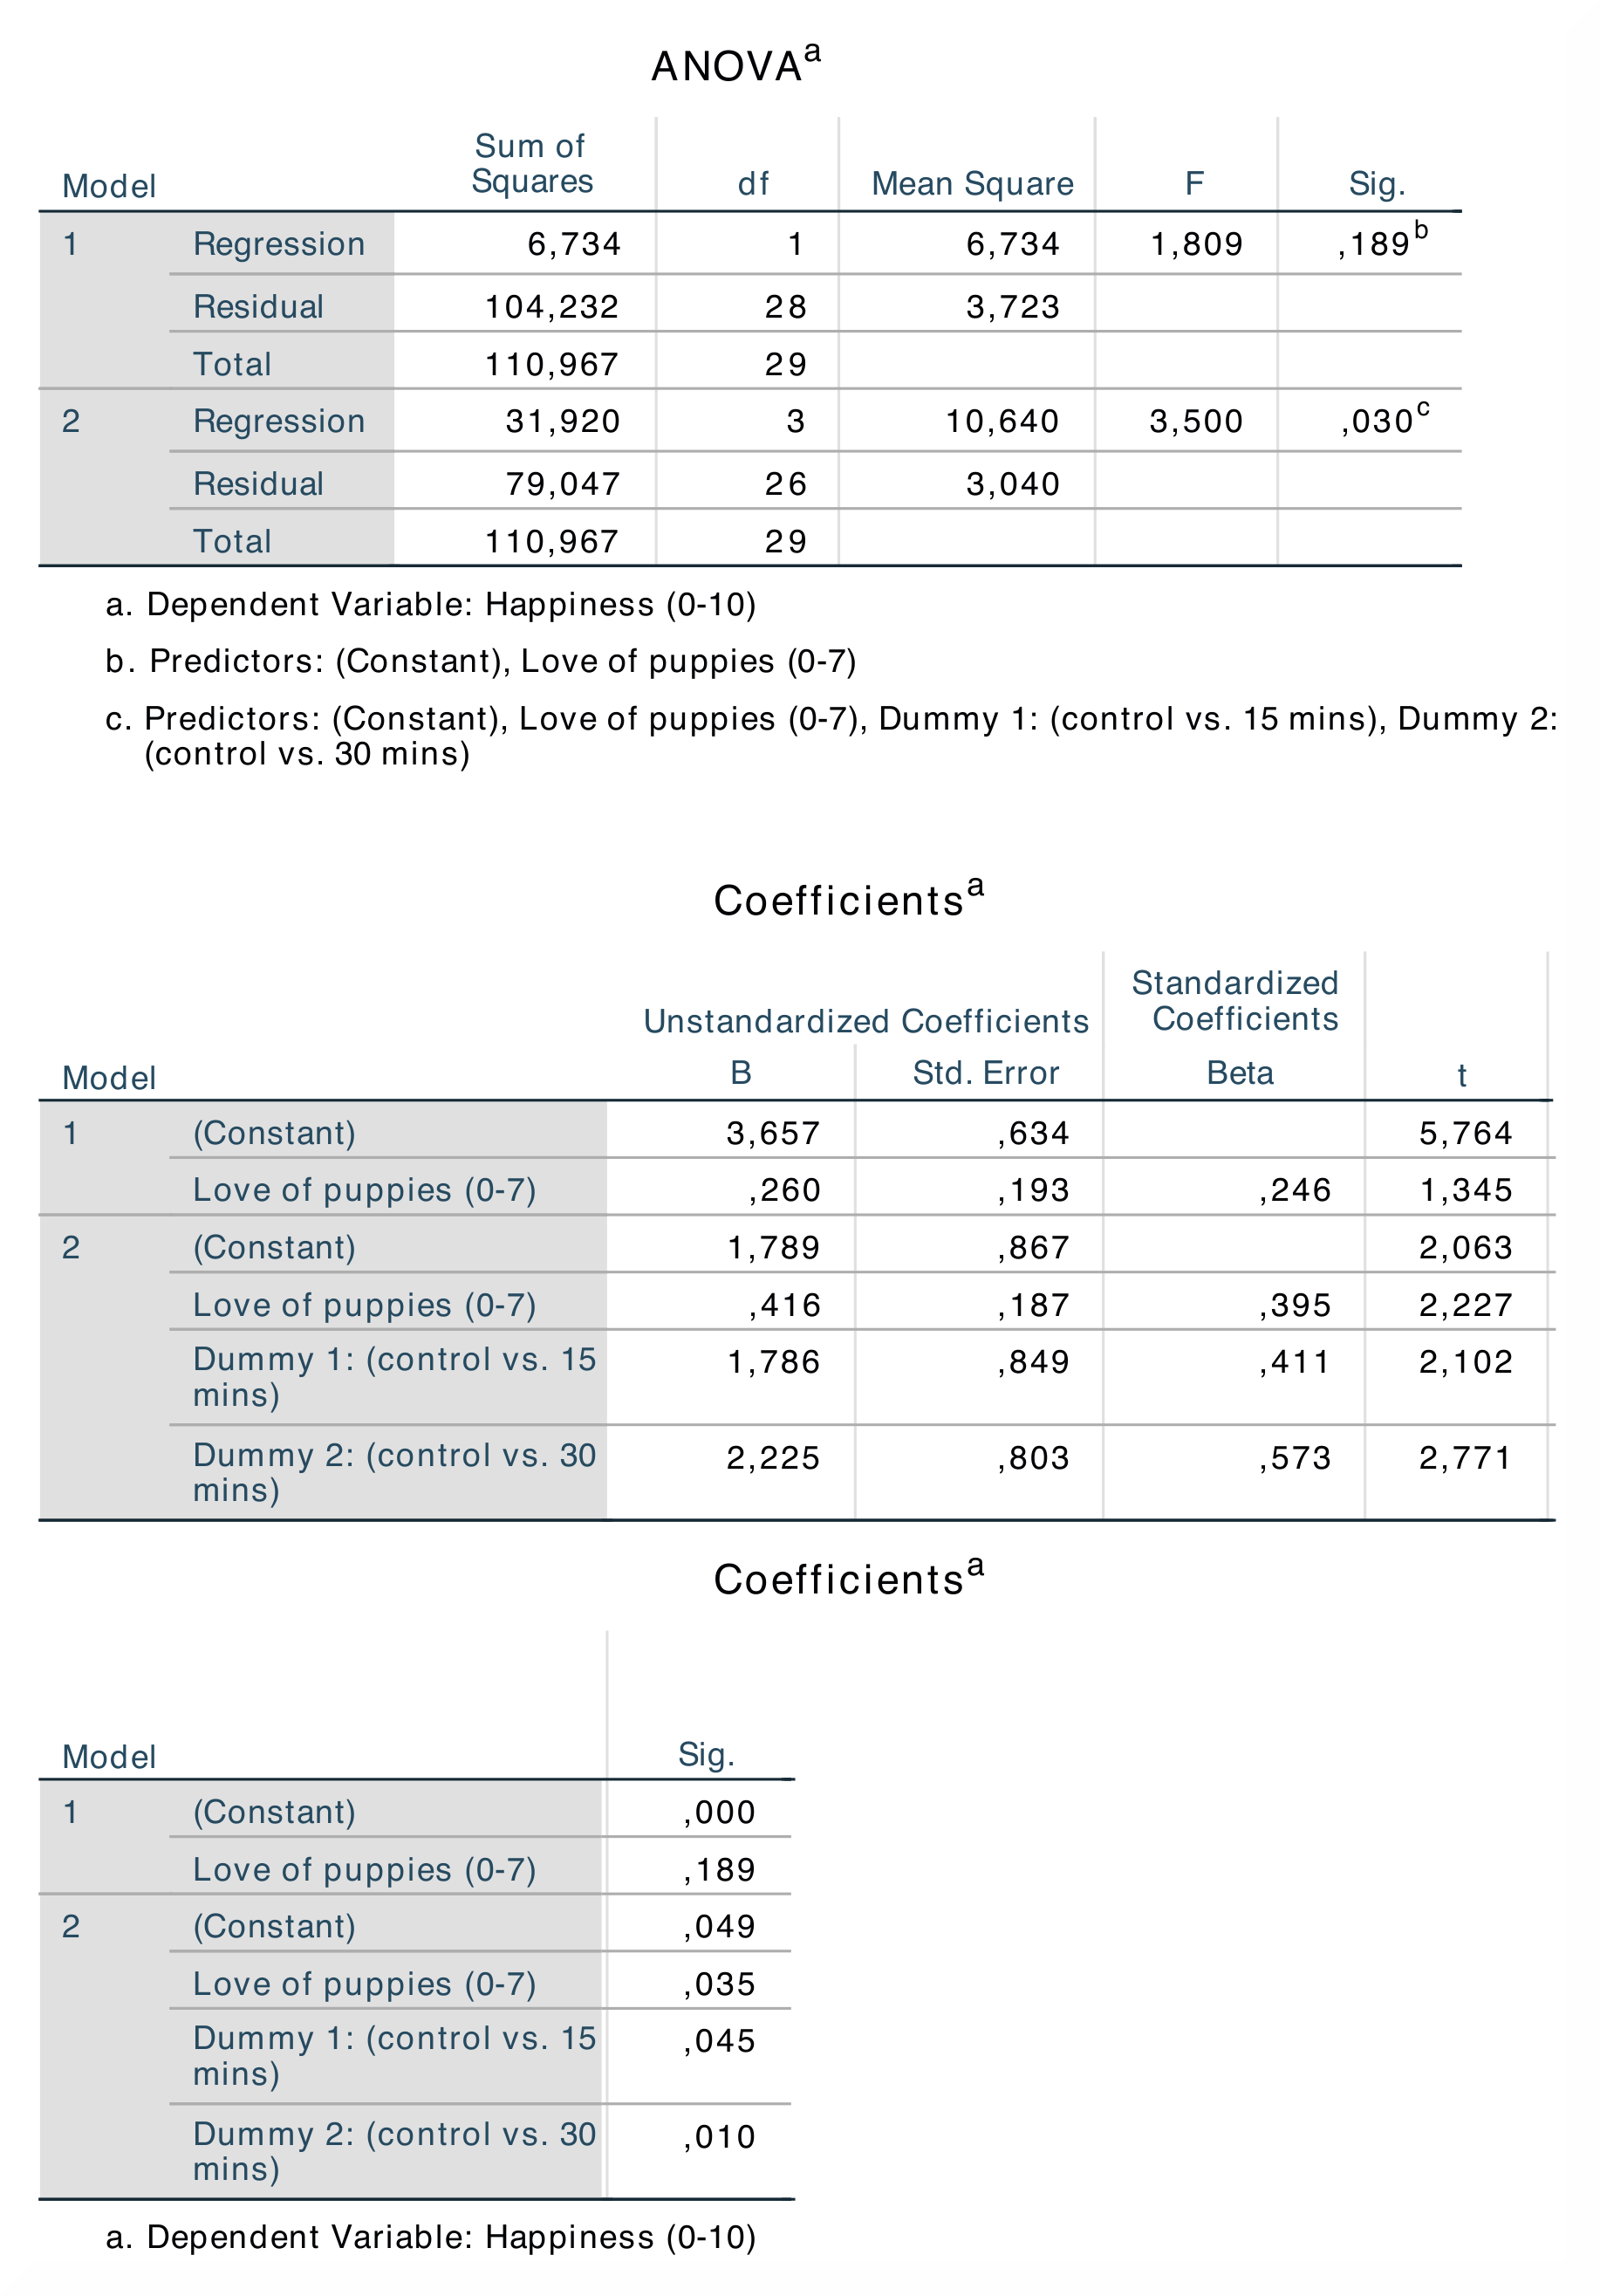
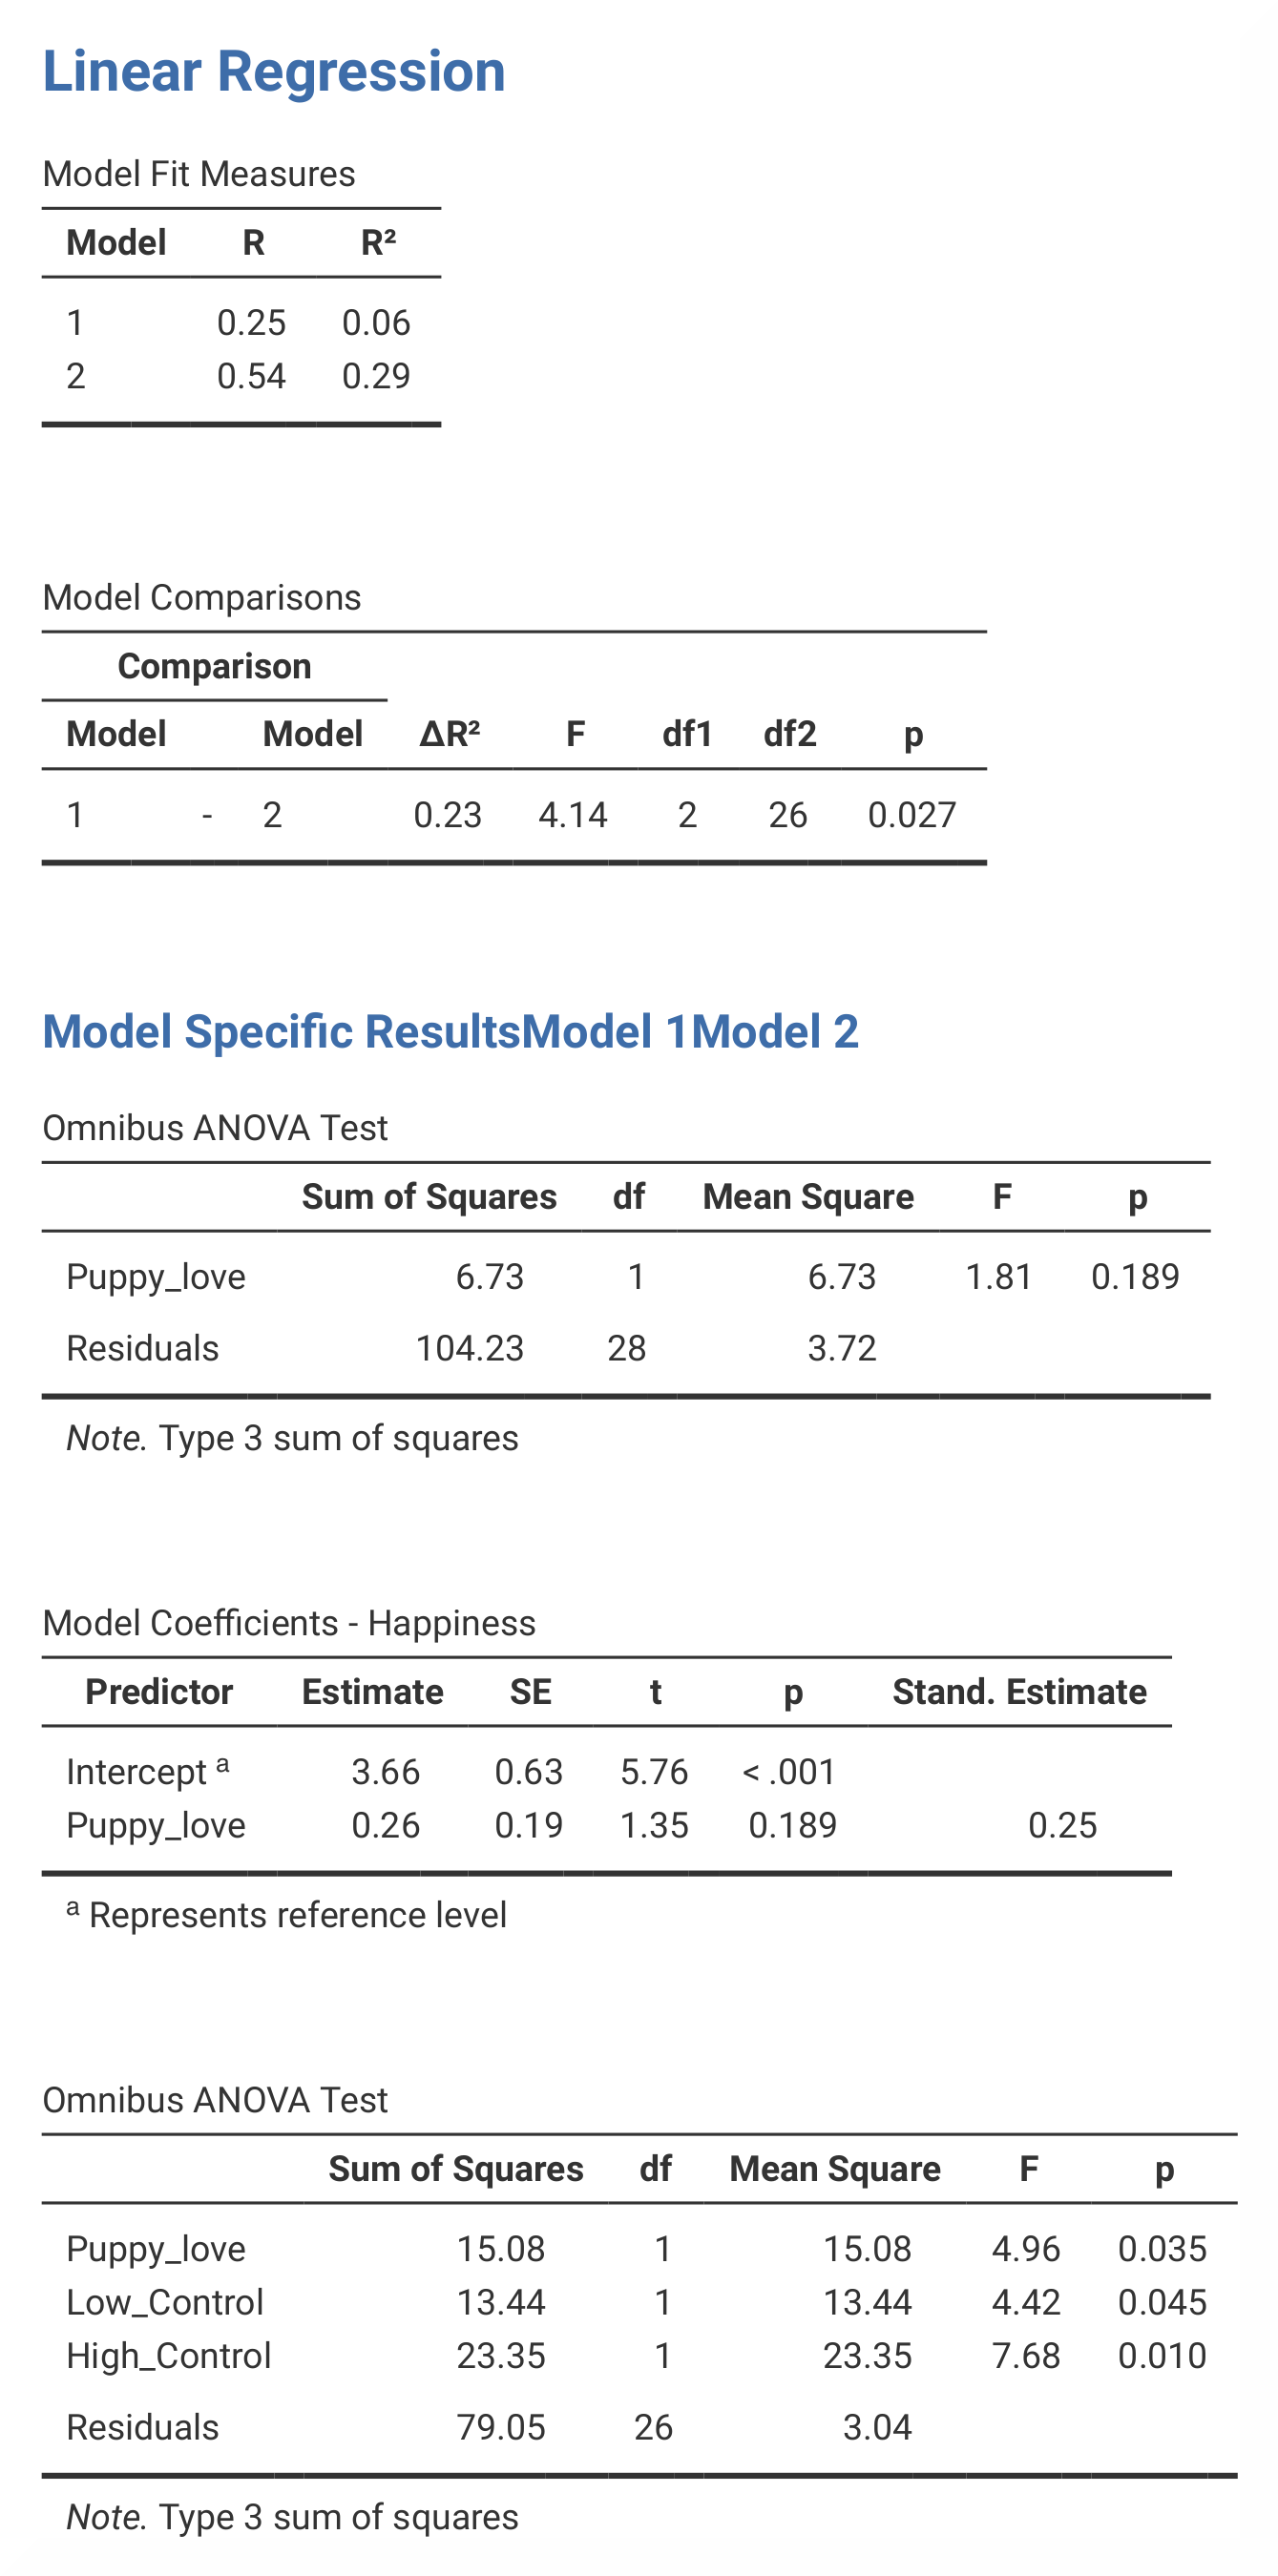
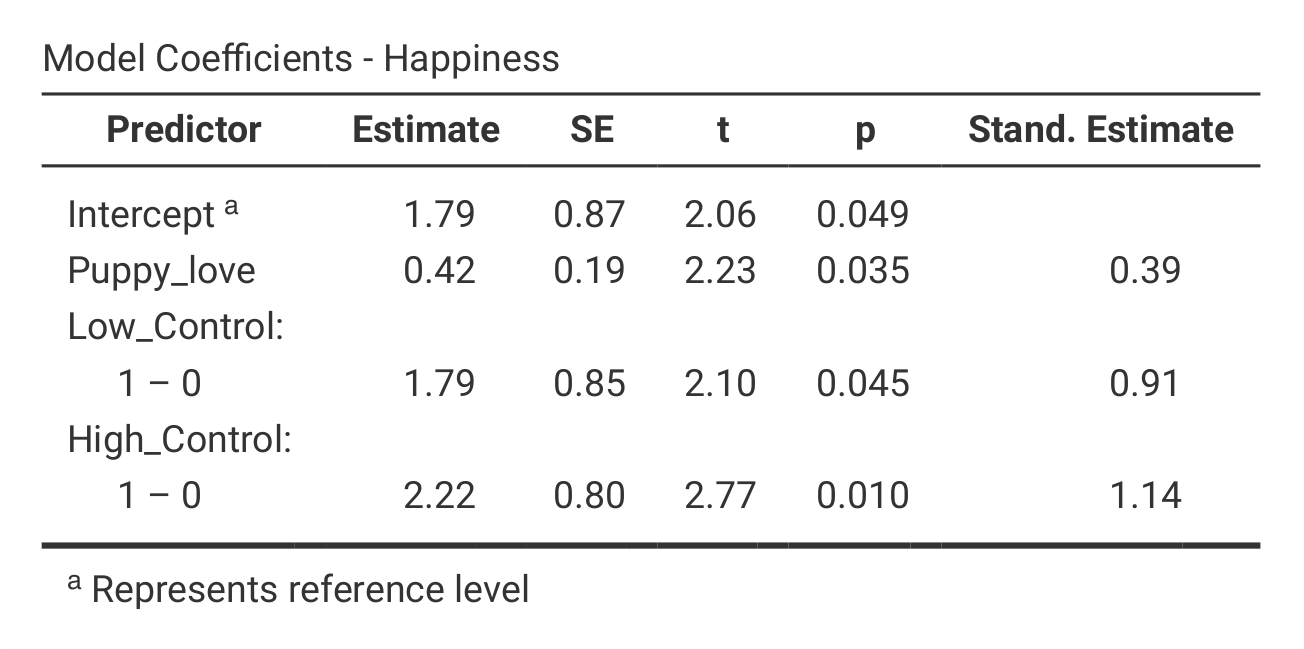
If you compare the SPSS and jamovi outputs, the results are the same. However, the output from jamovi is much clearer as it only includes the most important information. The results are found in slightly different places in SPSS and in jamovi. |
|
|
|
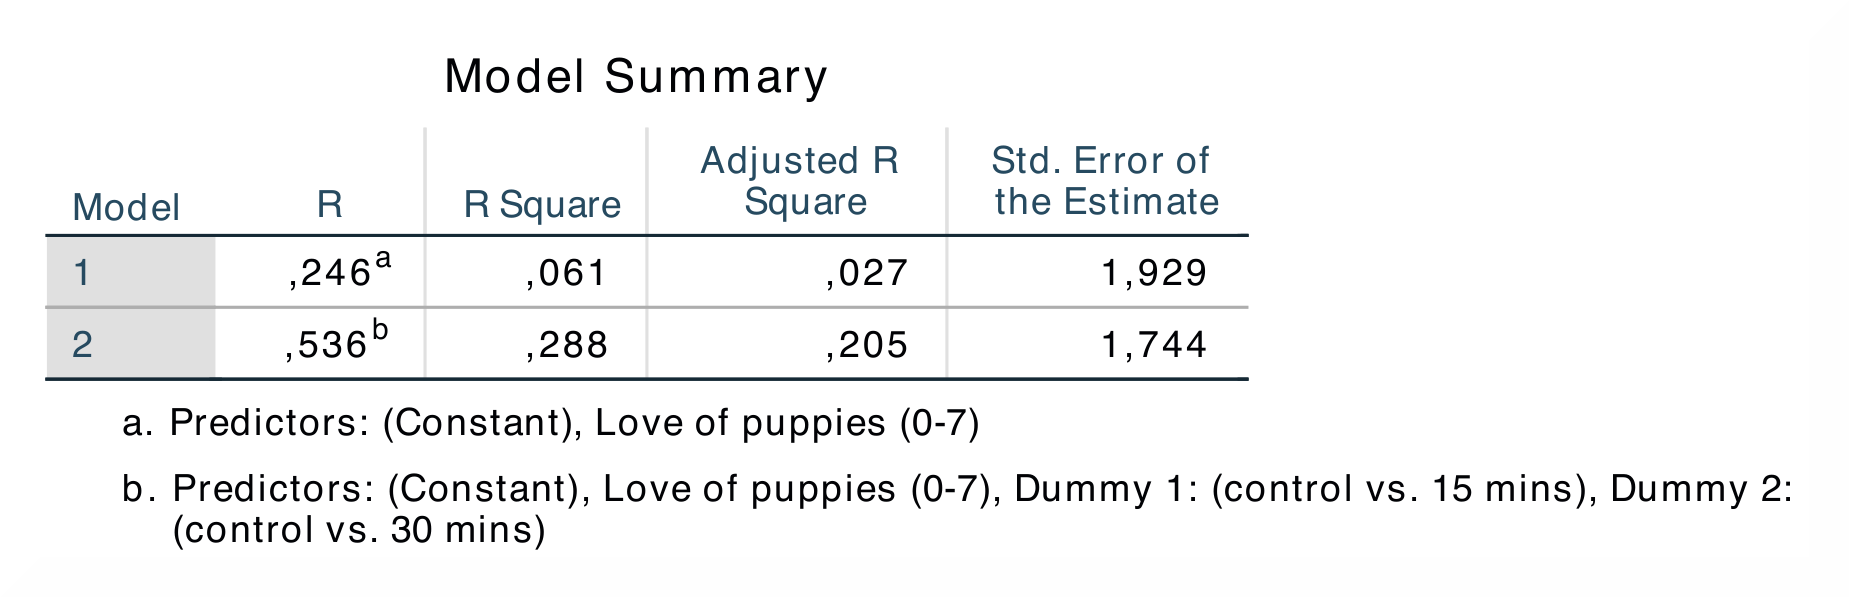
In SPSS, the output table |
In jamovi, the R *and *R²-values are found in the output table |
The R *and *R²-values are found in the first and second column in the first output table in both SPSS and jamovi. In contrast to SPSS, jamovi splits the
The numerical values for the model 2 statistics are identical: R = 0.54, R² = 0.29; b = 0.42, p < .05; β = 0.39, p < .05. |
|
If you wish to replicate those analyses using syntax, you can use the commands below (in jamovi, just copy to code below to Rj). Alternatively, you can download the SPSS output files and the jamovi files with the analyses from below the syntax. |
|
REGRESSION
  /MISSING LISTWISE
  /STATISTICS COEFF OUTS R ANOVA
  /CRITERIA=PIN(.05) POUT(.10)
  /NOORIGIN
  /DEPENDENT Happiness
  /METHOD=ENTER Puppy_love
  /METHOD=ENTER Low_Control High_Control.
|
jmv::linReg(
    data = data,
    dep = Happiness,
    covs = Puppy_love,
    factors = vars(Low_Control, High_Control),
    blocks = list(
        list("Puppy_love"),
        list("Low_Control", "High_Control")),
    refLevels = list(
        list(var="Low_Control", ref="0"),
         list(var="High_Control", ref="0")),
    anova = TRUE)
|