Section author: Rebecca Vederhus, Sebastian Jentschke
From SPSS to jamovi: Analysis of frequencies
This comparison shows how a Chi-square test is conducted in SPSS and jamovi. The SPSS test follows the description in chapters 19.7.2-19.7.3 in Field (2017), especially figures 19.4-19.5 and output 19.2-19.4. It uses the data set Cats Weight.sav which can be downloaded from the web page accompanying the book.
SPSS |
jamovi |
|---|---|
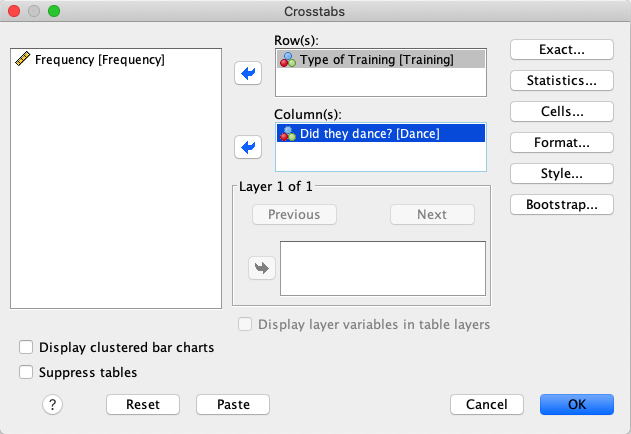
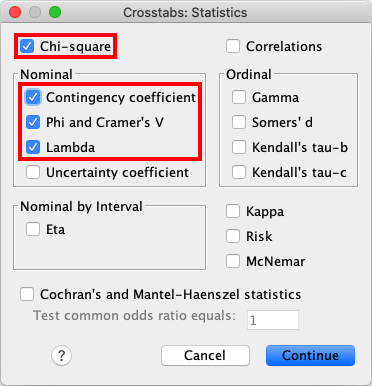
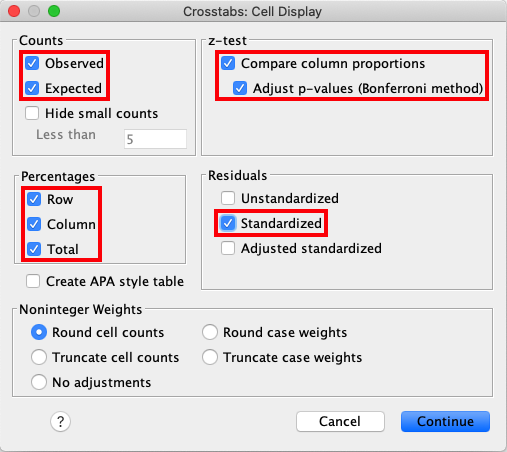
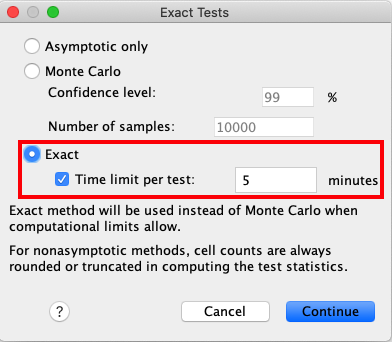
In SPSS, you run a chi-square test using : |
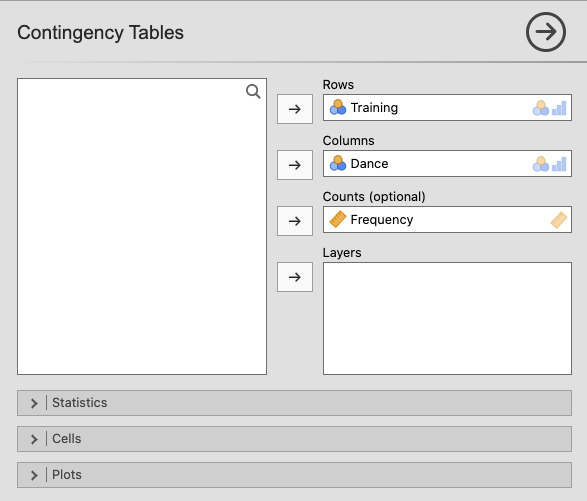
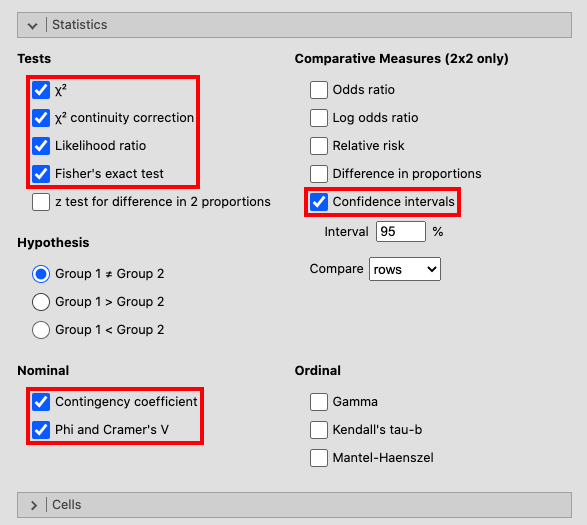
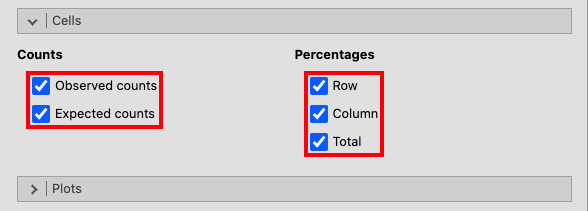
In jamovi, this can be done using: |
|
|
|
|
In the |
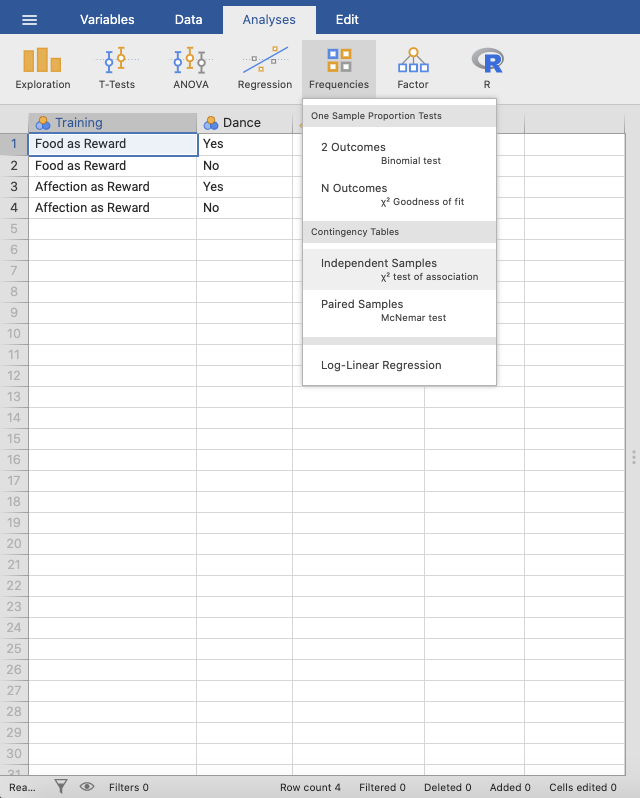
In jamovi, move |
|
|
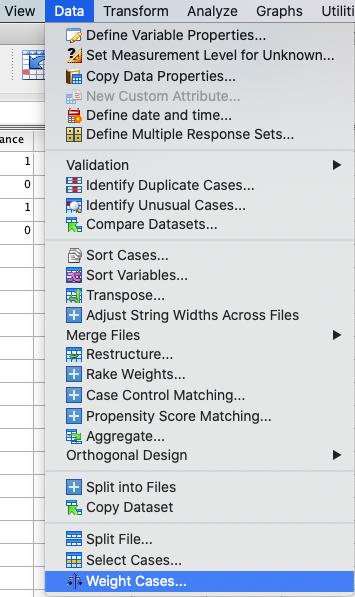
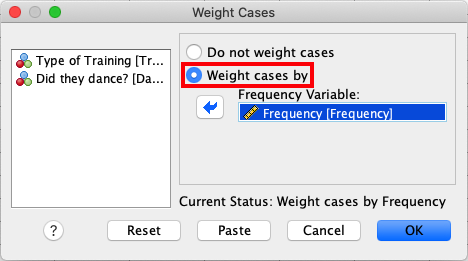
In SPSS, move the |
Open the |
|
|
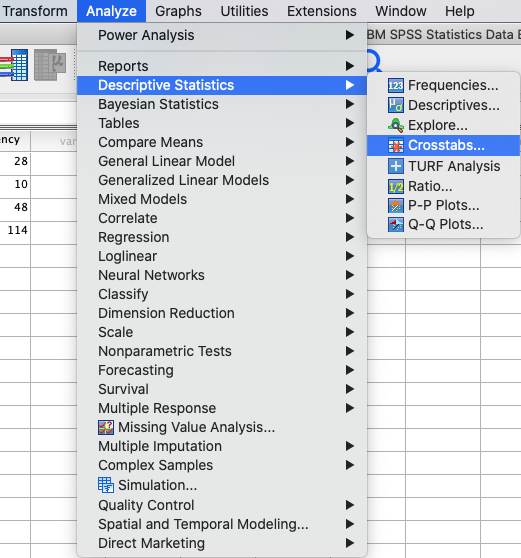
Open the |
In the window for |
|
|
Access |
|
|
|
Lastly, open the window for |
|
|
|
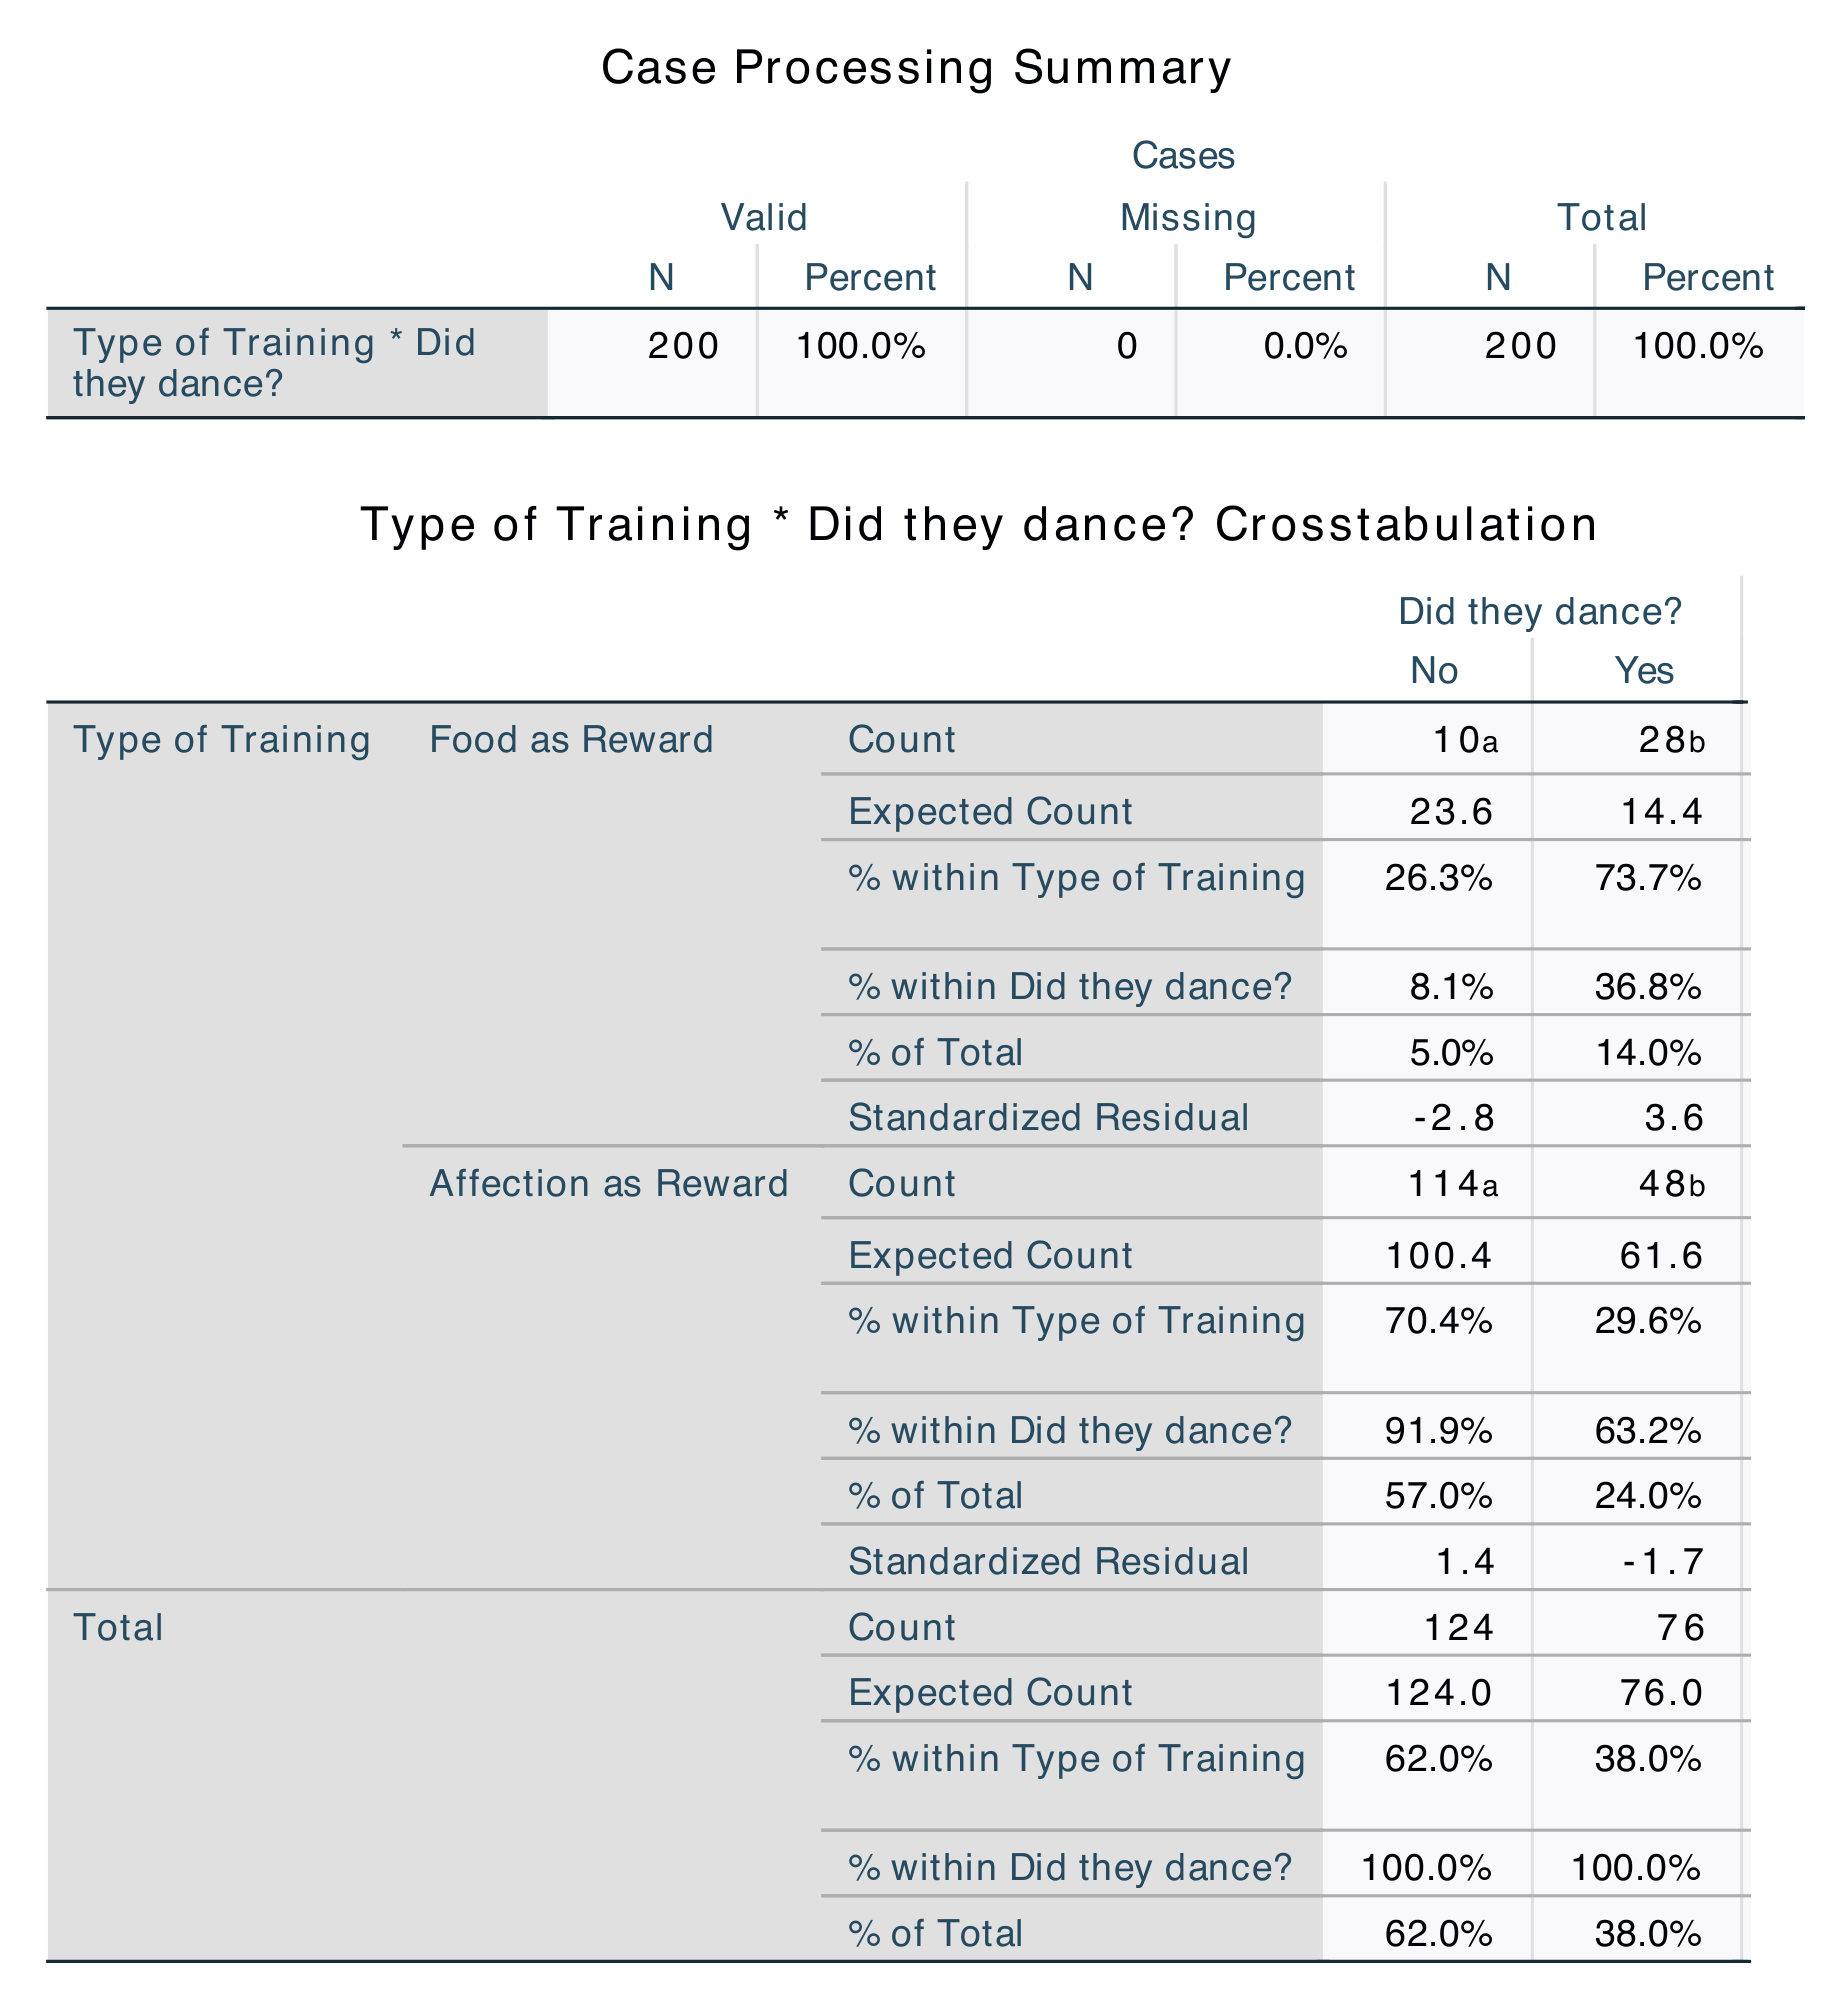
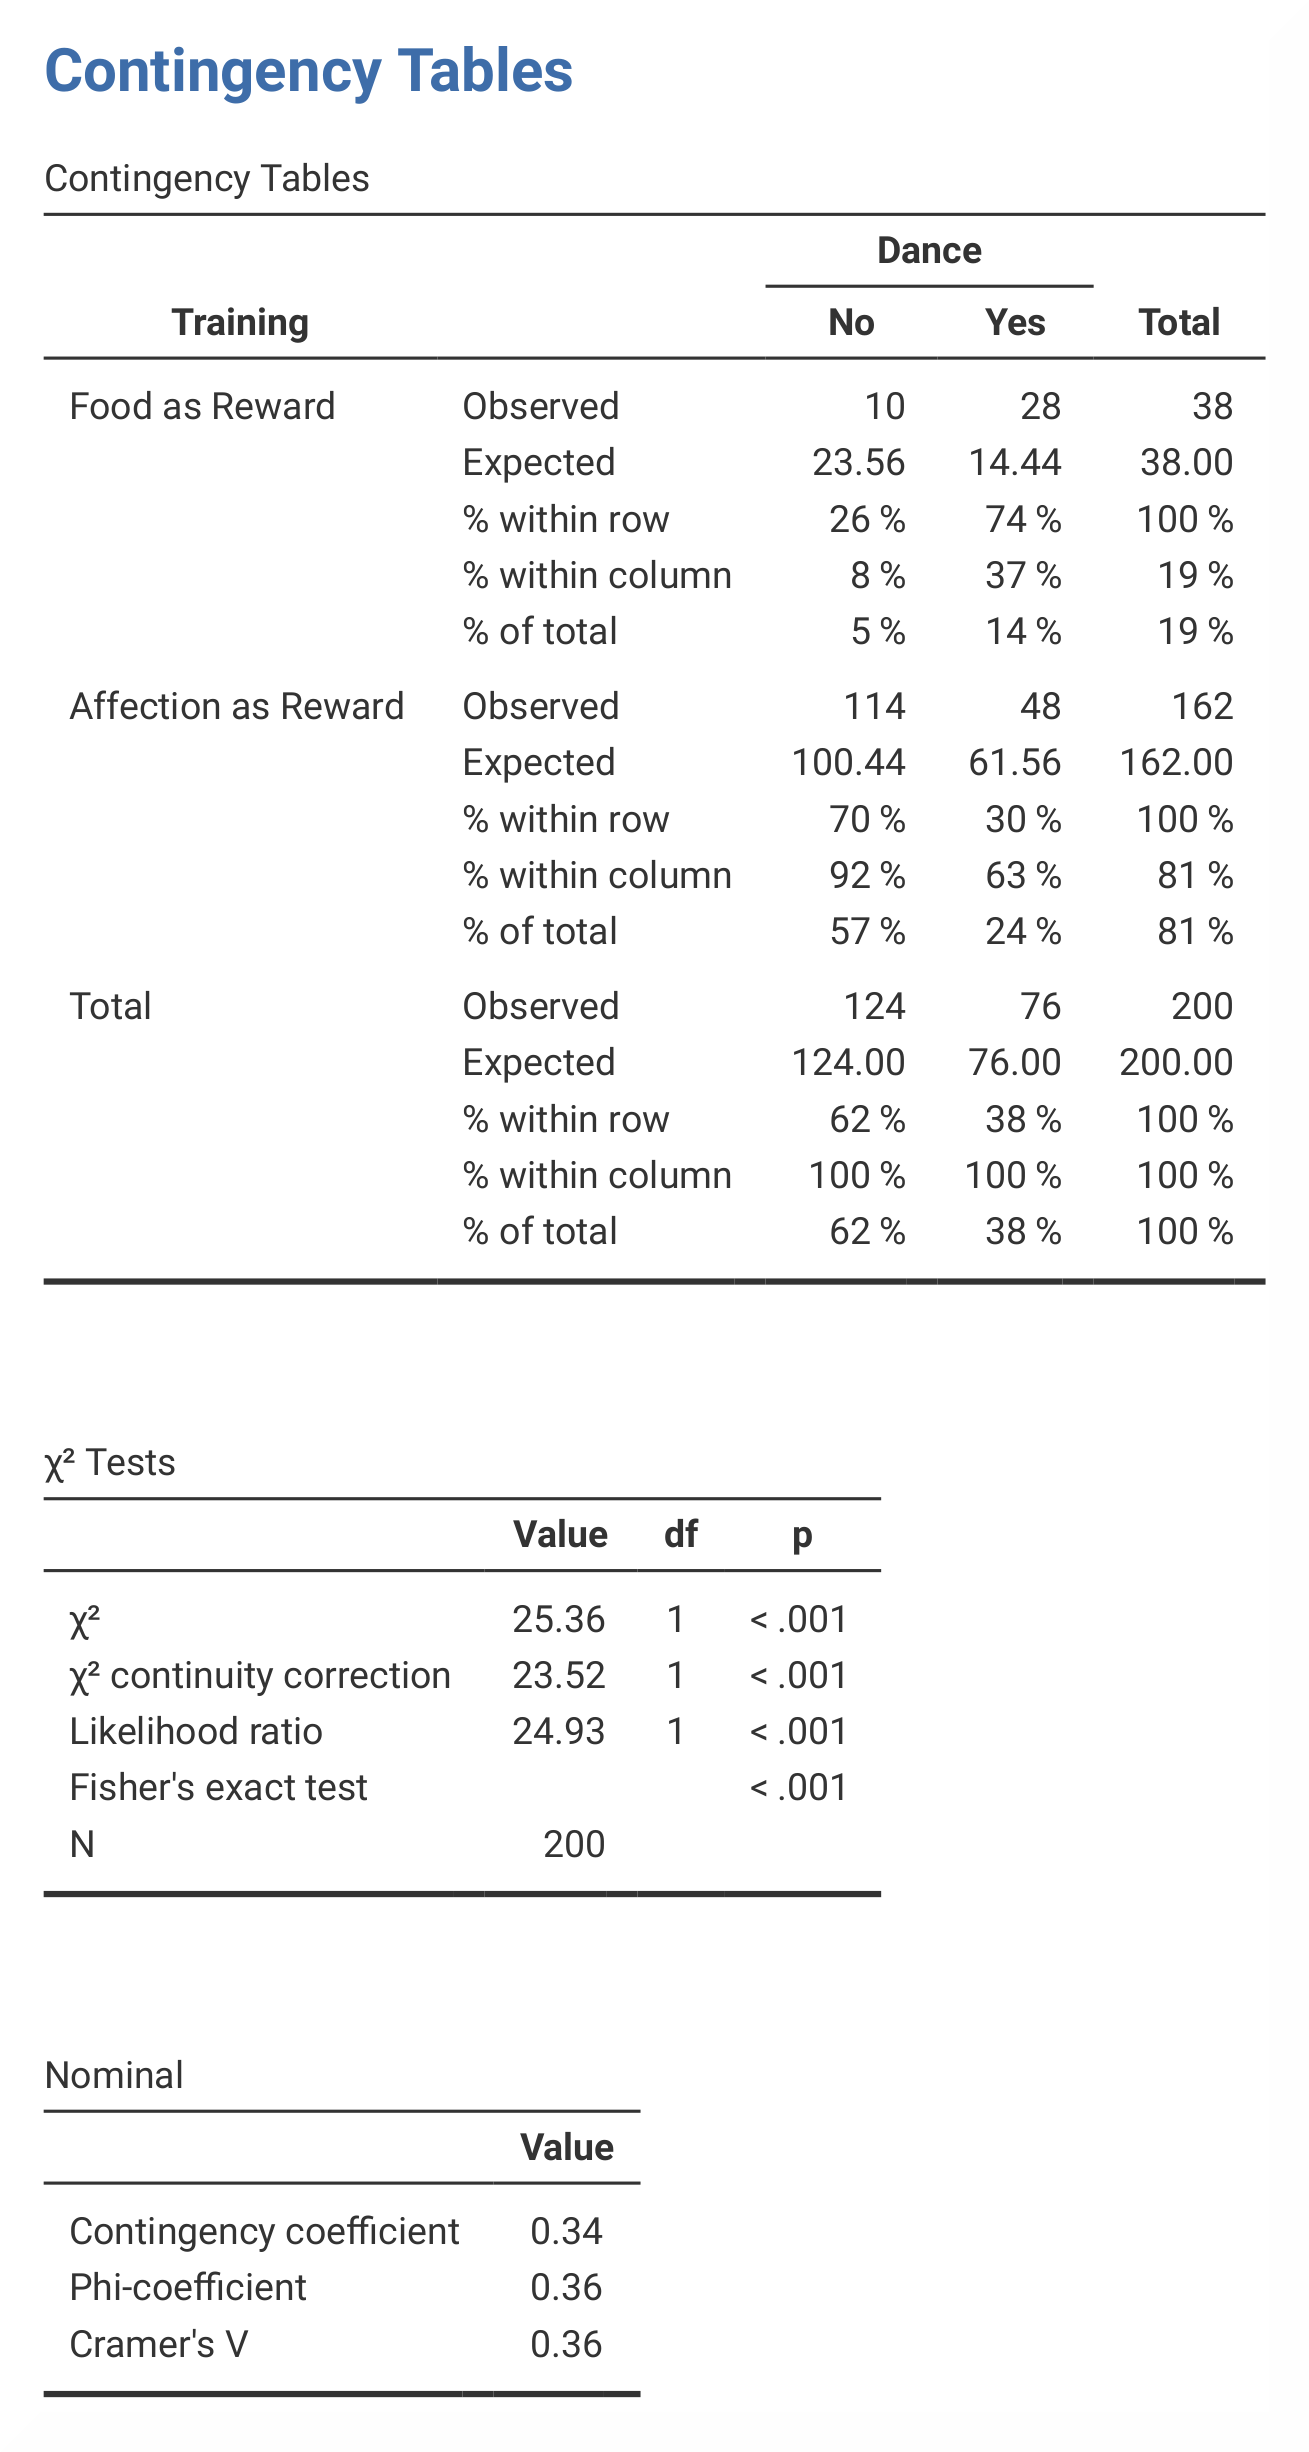
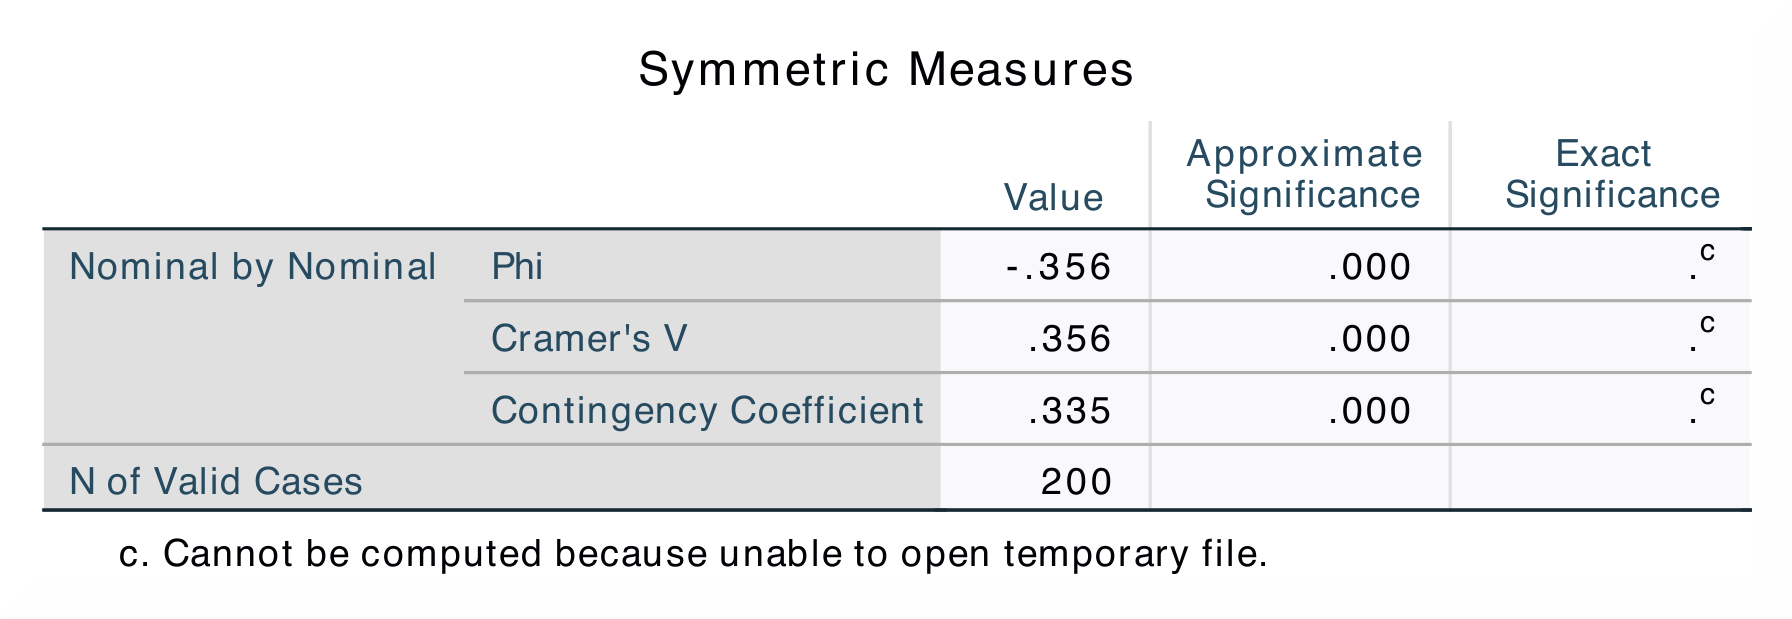
When comparing the output from SPSS and jamovi, the results are exactly the same, although in jamovi they are much clearer and therefore easier to interpret. |
|
|
|
|
|
|
|
In SPSS, the |
The contingency table in jamovi contains all the same values as in SPSS,
except for |
The only difference between the outputs in SPSS and jamovi is that SPSS produces The numerical values for the statistics are the same: χ² (1, N = 200) = 25.36, p < .001. |
|
If you wish to replicate those analyses using syntax, you can use the commands below (in jamovi, just copy to code below to Rj). Alternatively, you can download the SPSS output files and the jamovi files with the analyses from below the syntax. |
|
WEIGHT BY Frequency.
CROSSTABS
  /TABLES=Training BY Dance
  /FORMAT=AVALUE TABLES
  /STATISTICS=CHISQ CC PHI LAMBDA
  /CELLS=COUNT EXPECTED ROW COLUMN TOTAL SRESID BPROP
  /COUNT ROUND CELL
  /METHOD=EXACT TIMER(5).
|
jmv::contTables(
    formula = Frequency ~ Training:Dance,
    data = data,
    chiSqCorr = TRUE,
    likeRat = TRUE,
    fisher = TRUE,
    contCoef = TRUE,
    phiCra = TRUE,
    exp = TRUE,
    pcRow = TRUE,
    pcCol = TRUE,
    pcTot = TRUE)
|