Section author: Laiton Hedley
Data Variables
All data you bring into or enter directly in jamovi starts as Data Variables. These columns form the raw data used as the basis for your analyses. Opening a dataset (such as a .csv file) or typing values into the spreadsheet creates these variables automatically.
Measure and Data Types
Every variable in jamovi has a Measure type and a Data type that indicate the kind of data it contains and how it should be treated in analyses.
Data types can be:
Integer: whole numbers without decimal points.
Decimal: numbers with decimal points.
Text: text, words, or categories (strings).
Note
jamovi does not support a native date and time data type at this time. You can represent dates and times as text and use a number of date manipulations — see Date Handling for details.
Measure types indicate the level of measurement:
 Continuous: Numbers where a continuum of values is meaningful, such as height, weight, or counts.
 Ordinal: Discrete values where order is meaningful (e.g., ‘Strongly agree’, ‘Agree’ or ‘< 18’, ‘18–30’).
 Nominal: Discrete values with no meaningful order (e.g., Male, Female or ‘Smoker’, ‘Non-smoker’).
 ID: Unique identifiers for each row or participant (e.g., participant numbers or names).
jamovi combines ratio and interval into the Continuous measure type. The ID type is useful for identifiers you don’t usually analyse, as it improves performance with large datasets.
Note
Not all combinations of data type and measure type are valid. For example, a variable cannot be both Text and Continuous, or Decimal and Nominal.
When you bring in data, jamovi automatically assigns these types based on the content. If the automatic assignment isn’t what you need, you can adjust it manually.
Double-click a column header to open the variable editor. From here, you can see and modify the variable’s name, description, data type, and measure type.
For example, if a variable representing a performance percentage incorrectly appears as Nominal with an Ordinal measure type:
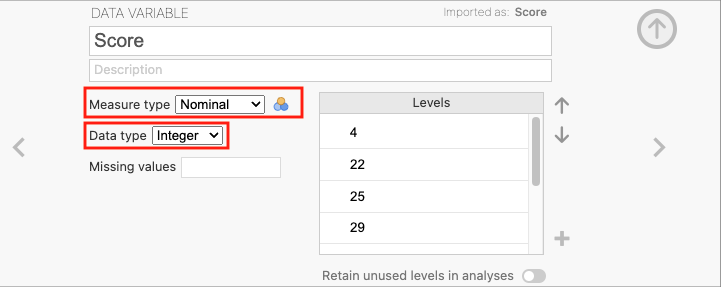
Click the Measure type to open the drop-down menu and select Continuous.
Click the Data type and select Decimal.
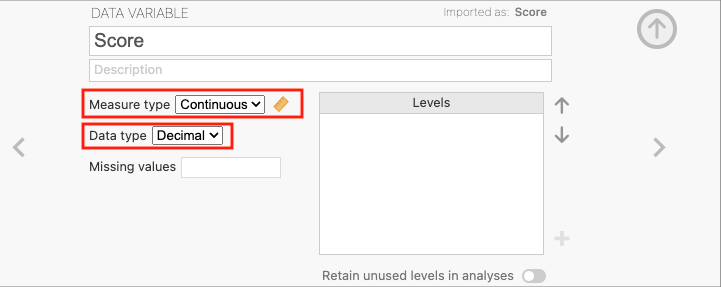
jamovi now treats this variable as continuous, allowing you to use it in analyses like correlation or regression, or in mathematical operations like computing a z-score.
Missing Values
In jamovi, missing values are represented as blank cells in the data view.
If your dataset uses special values to encode missing data (like -99 or 9999), analyses will treat them as actual values unless you instruct jamovi otherwise. To do this:
Open the variable editor by double-clicking the column header.
Click Missing values.
Click Add Missing Value.
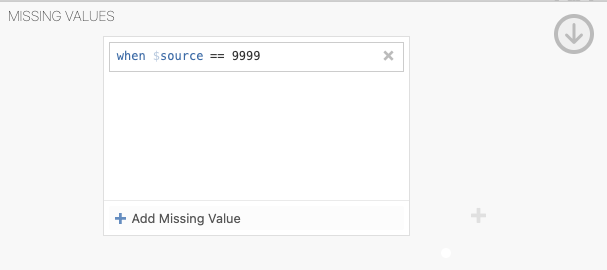
Specify whether to treat values that are equal to, less than, or greater than a number as missing.
For example, to treat any value equal to 9999 as missing, use the formula == 9999:
Adding Labels to Levels
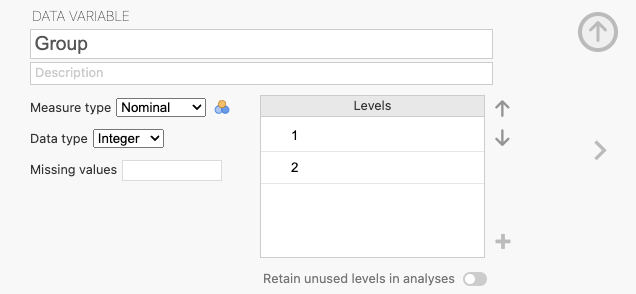
For Nominal or Ordinal variables, you can add descriptive labels to the levels. This makes your output much easier to read. Below is a variable called “Group” using numeric codes:
ID |
Group |
|---|---|
1 |
1 |
2 |
2 |
3 |
1 |
4 |
2 |
In this case, 1 represents “Smoker” and 2 represents “Non-smoker”. To assign these labels, open the variable editor:
Click on the current levels (1 and 2) and type the meaningful labels:
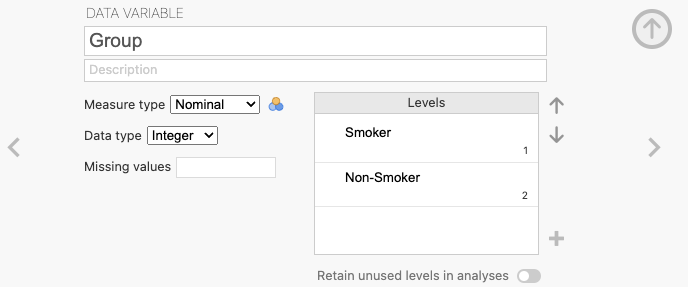
The variable now displays these labels in all analyses and results:
ID |
Group |
|---|---|
1 |
Smoker |
2 |
Non-smoker |
3 |
Smoker |
4 |
Non-smoker |
Reordering Levels
For Ordinal (and sometimes Nominal) variables, you can reorder the levels so they appear intuitively in tables and figures.
For example, if “Task Difficulty” levels appear in the wrong order:
Task Difficulty |
Mean |
Standard Deviation |
|---|---|---|
Low |
85.1 |
9.5 |
High |
54.3 |
9.1 |
Medium |
73.6 |
9.3 |
Double-click the variable header to open the variable editor.
Click a level in the list and use the arrow keys to move it.
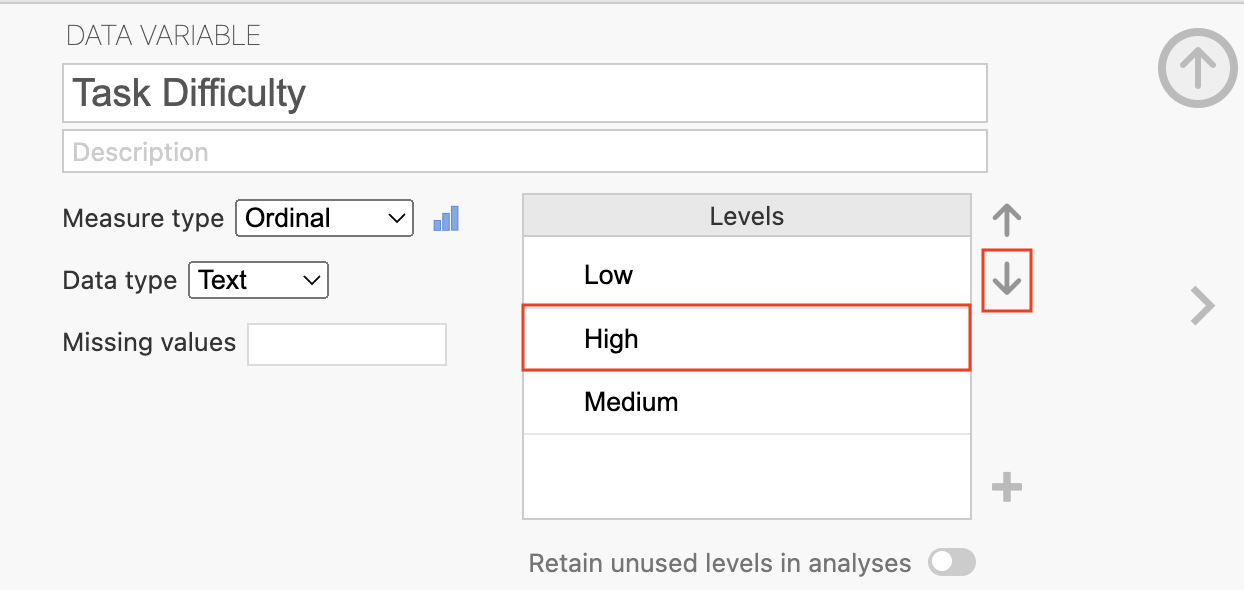
The level at the top of the list will appear first (leftmost or topmost) in all tables and figures:
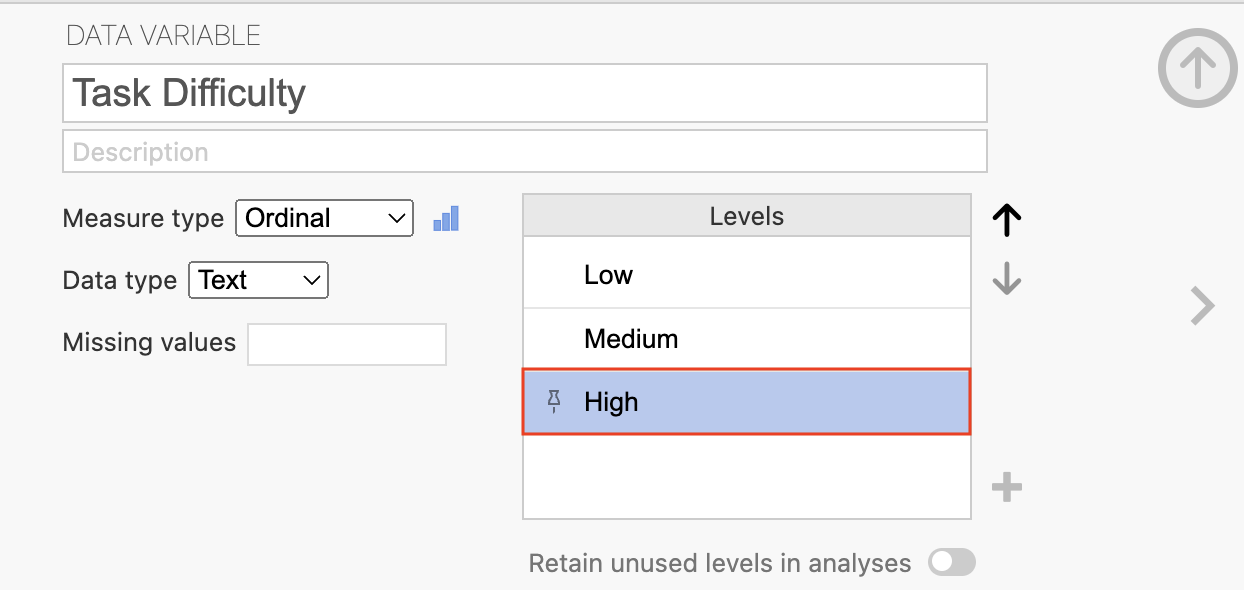
The table now displays levels in the natural order: Low, Medium, High.
Task Difficulty |
Mean |
Standard Deviation |
|---|---|---|
Low |
85.1 |
9.5 |
Medium |
73.6 |
9.3 |
High |
54.3 |
9.1 |
Retain Unused Levels in Analyses
If a categorical variable has valid levels that don’t appear in your current data, you can still include them in your reporting.
For example, if you ask Adult and Child moviegoers if they enjoyed a film and everyone answers “Yes”, the “No” level is absent but still relevant.
Age Group |
Enjoyed Film (Y/N) |
|---|---|
Adult |
Yes |
Adult |
Yes |
Adult |
Yes |
Child |
Yes |
Child |
Yes |
Child |
Yes |
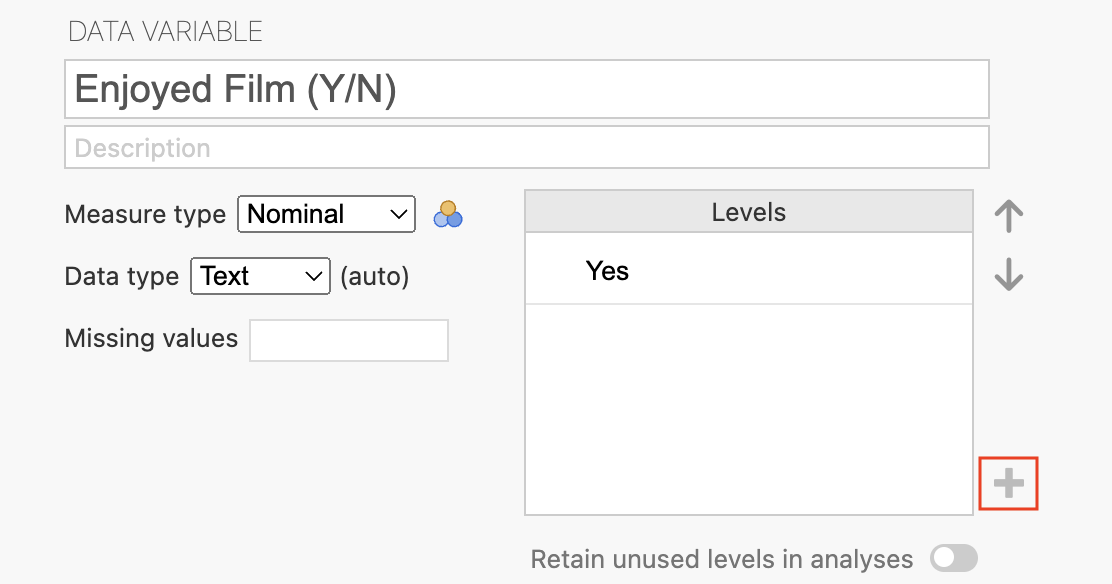
To retain the “No” level in your tables:
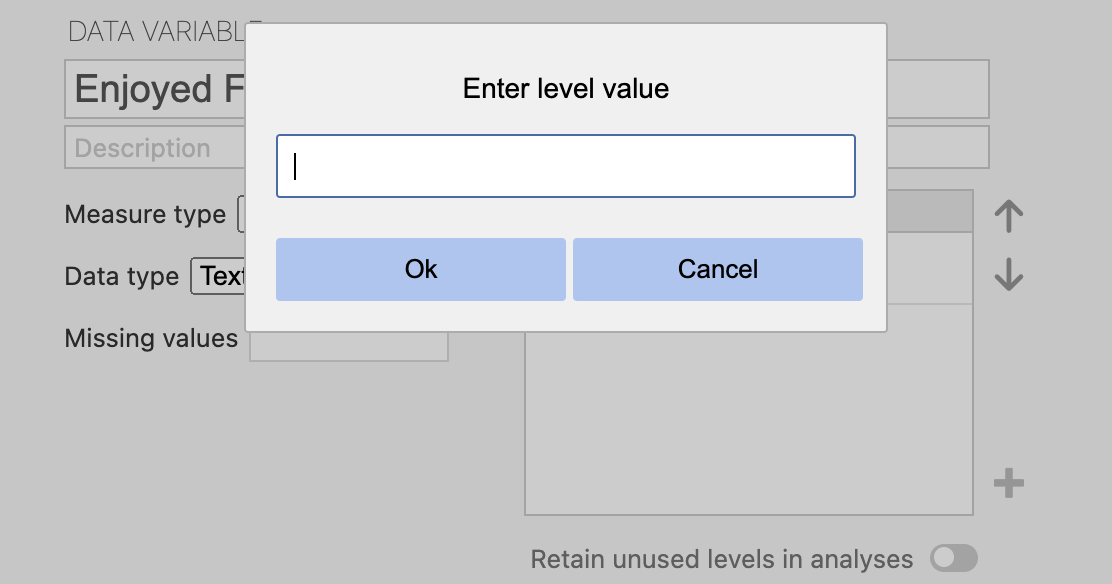
Open the variable editor.
Click the plus sign (+) at the bottom of the levels list.
Type “No” to add the level.
Click the Retain unused levels in analyses toggle.
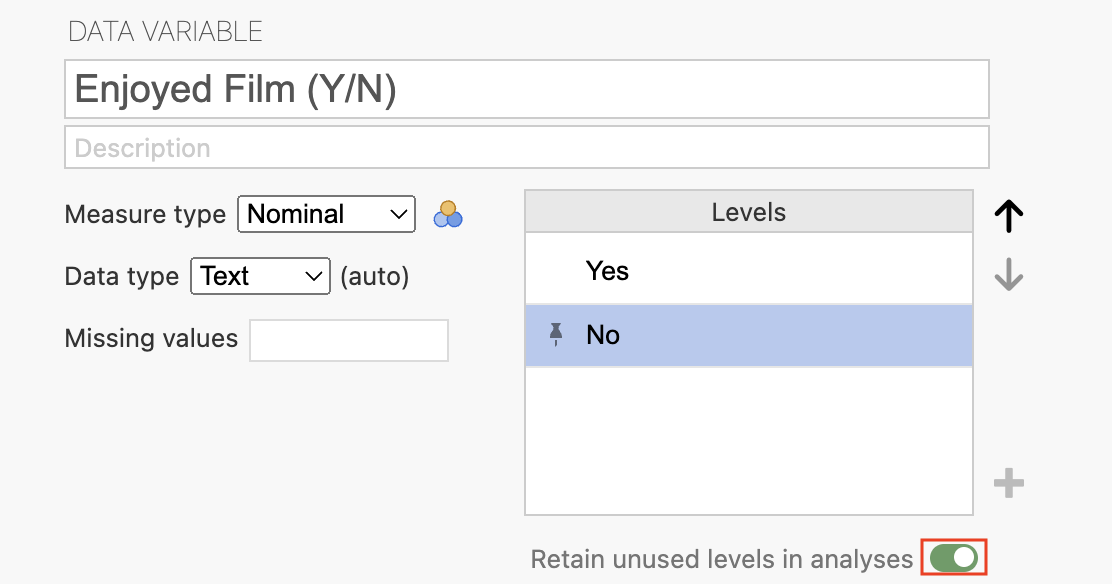
The “No” level will now appear in your tables and figures even with no matching participants.