Section author: Rebecca Vederhus, Sebastian Jentschke
From SPSS to jamovi: Non-parametric analyses
This comparison shows how a Wilcoxon signed-rank test is conducted in SPSS and jamovi. The SPSS test follows the description in chapter 7.5.2 in Field (2017), especially figure 7.9 and output 7.3 - 7.4. It uses the data set Drug.sav which can be downloaded from the web page accompanying the book.
SPSS |
jamovi |
|---|---|
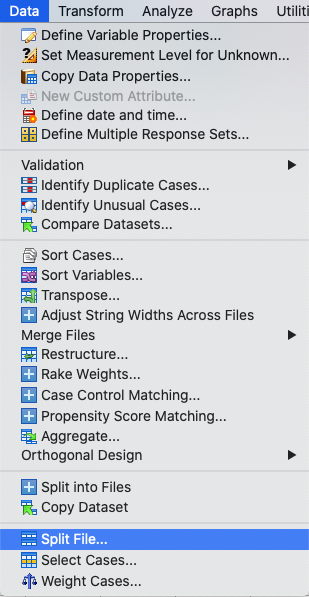
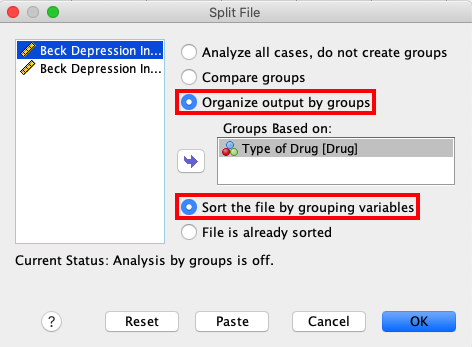
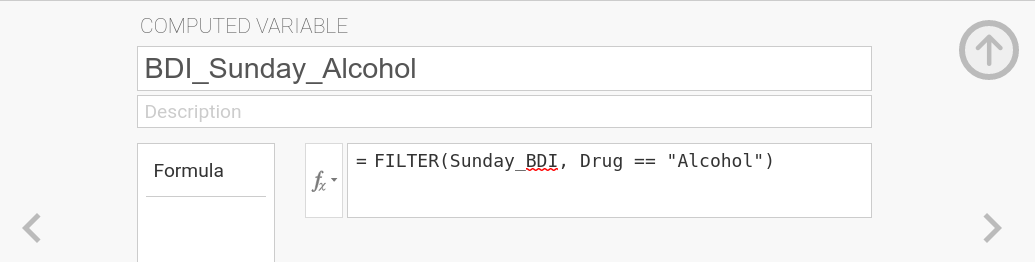
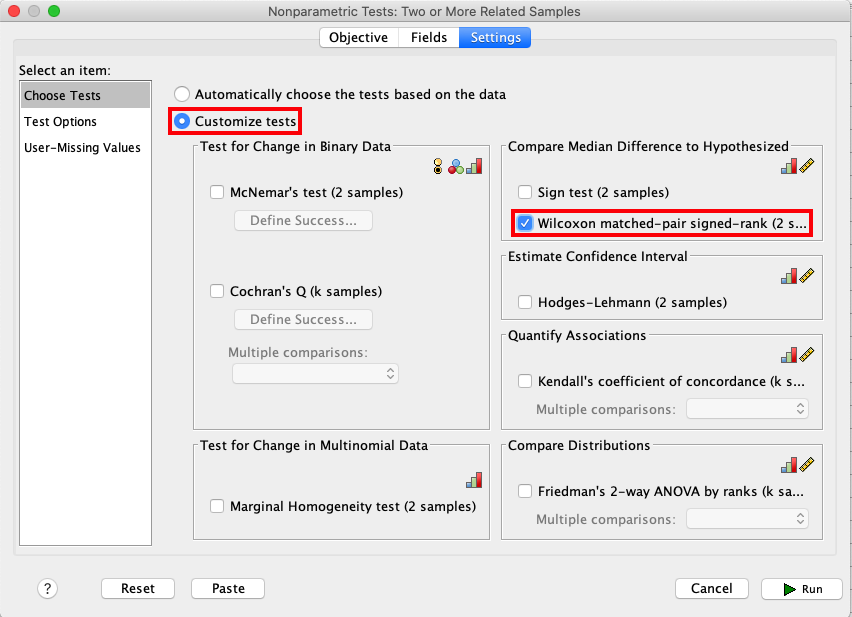
In SPSS, first split the file using |
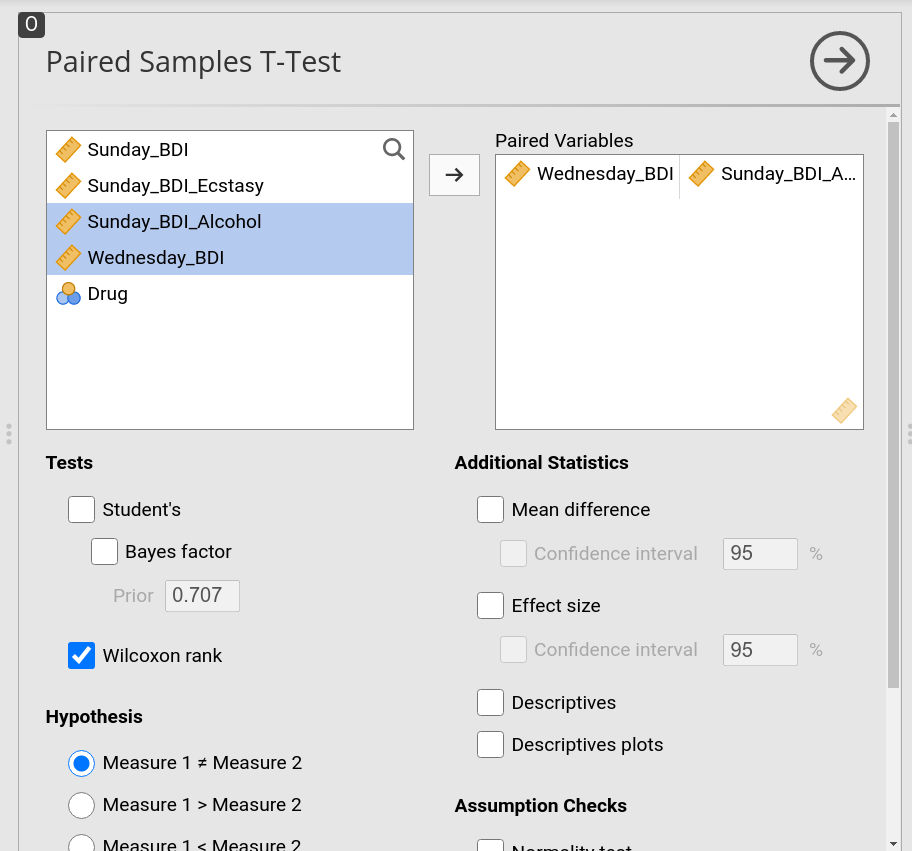
In jamovi, the |
|
|
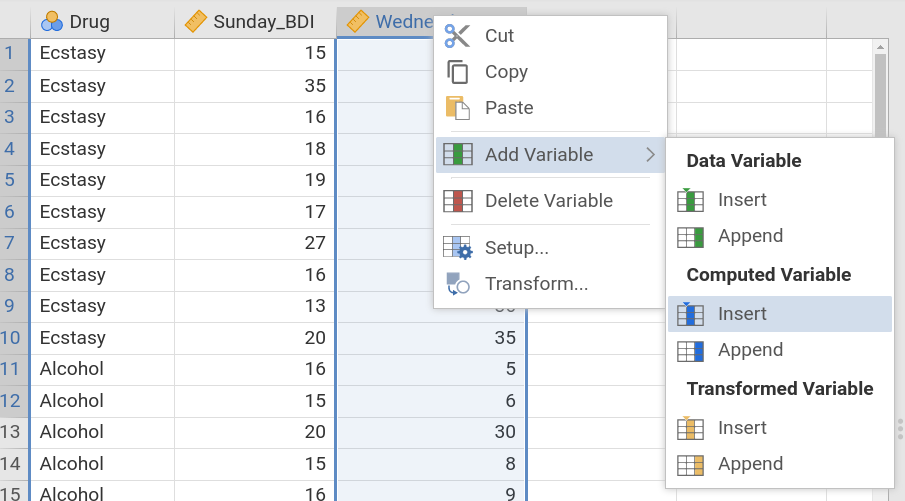
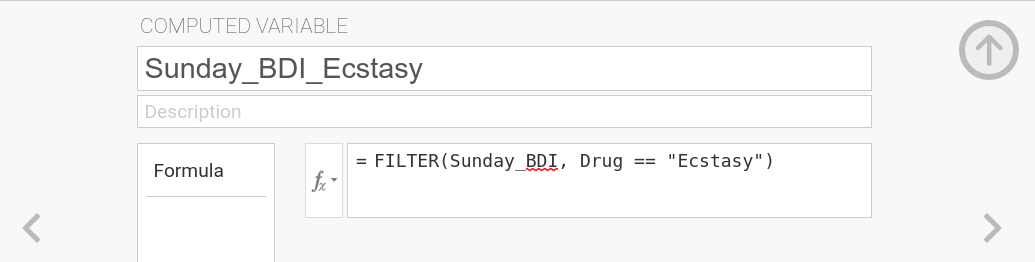
In the |
|
|
|
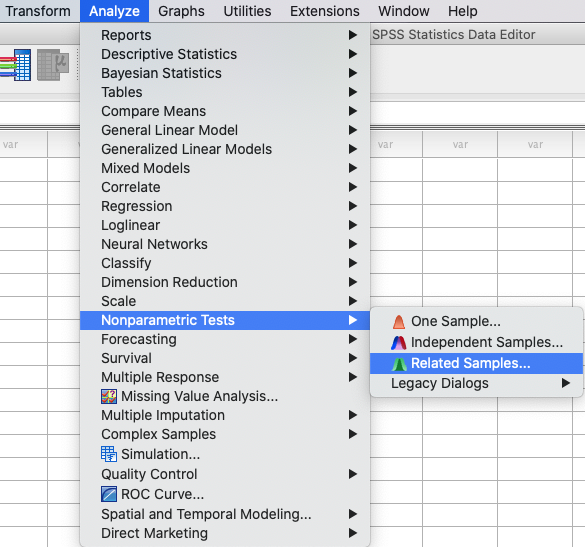
Then, create a Mann-Whitney test using: |
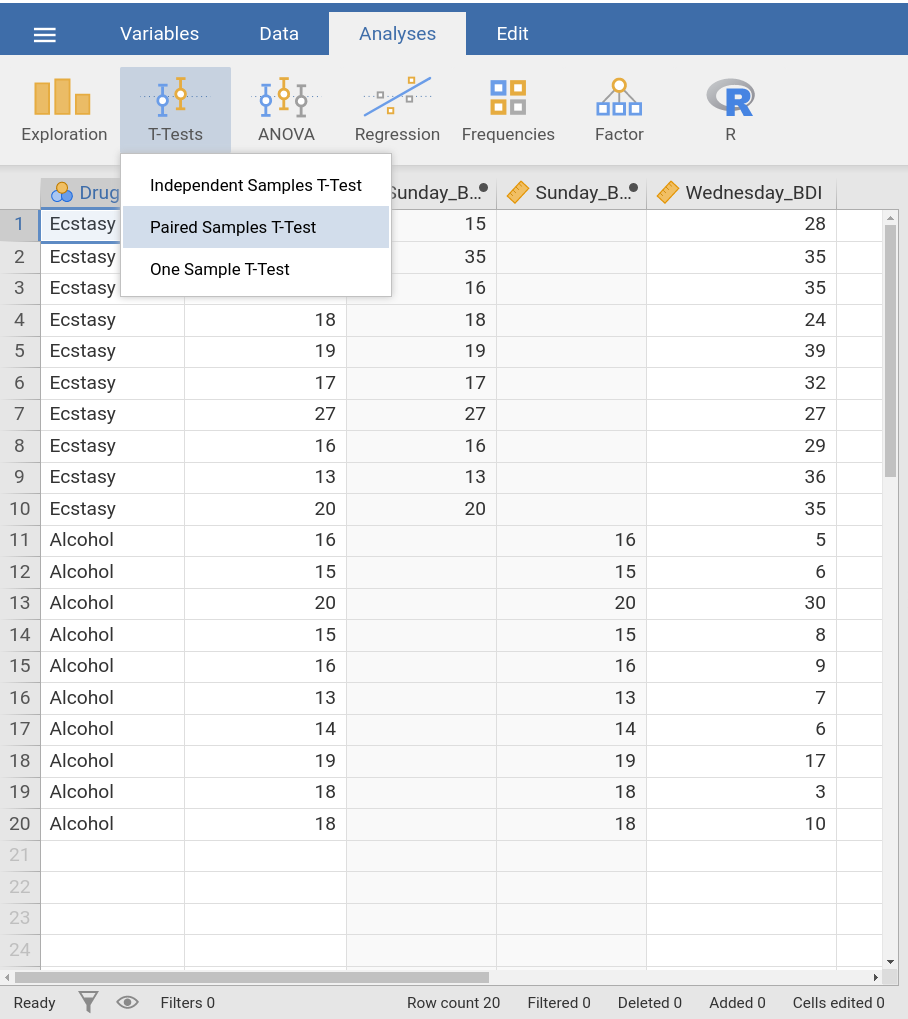
Create a Wilcoxon signed-rank test using: |
|
|
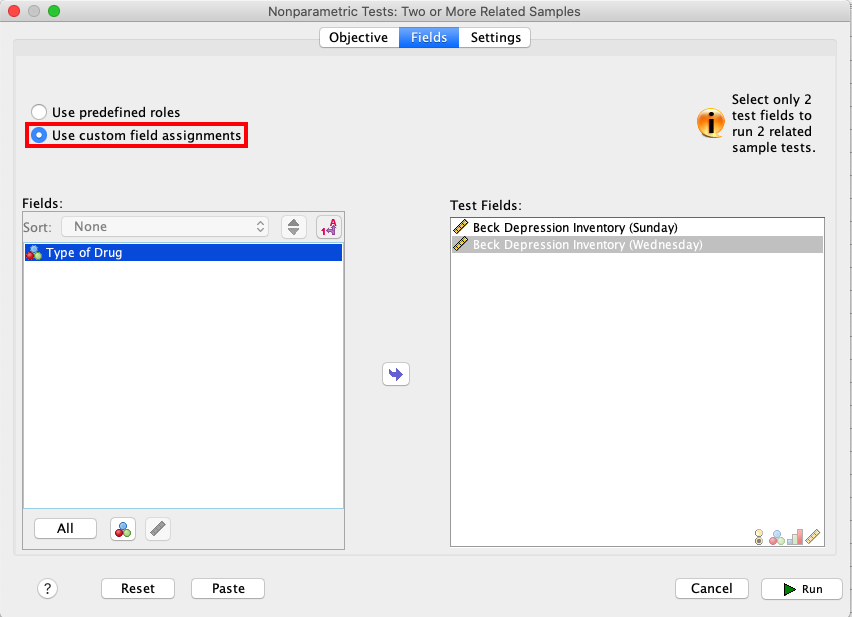
In the |
Select |
|
|
Lastly, open |
|
|
|
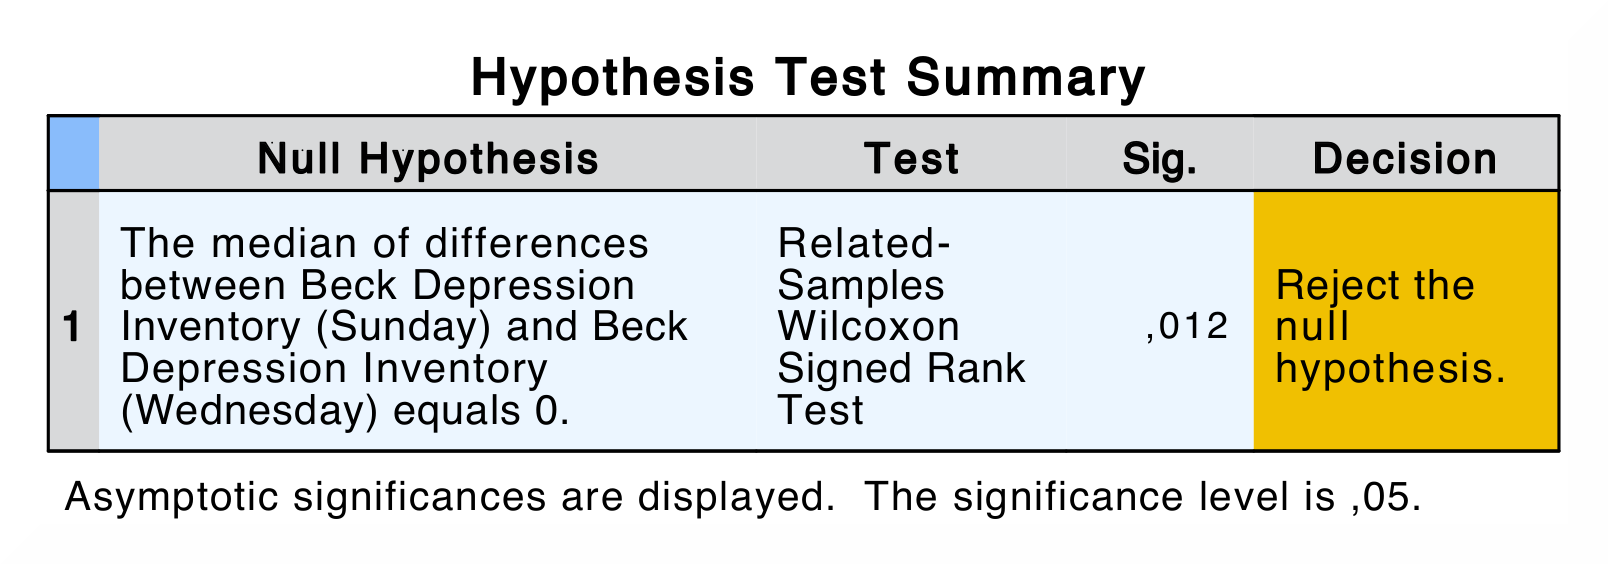
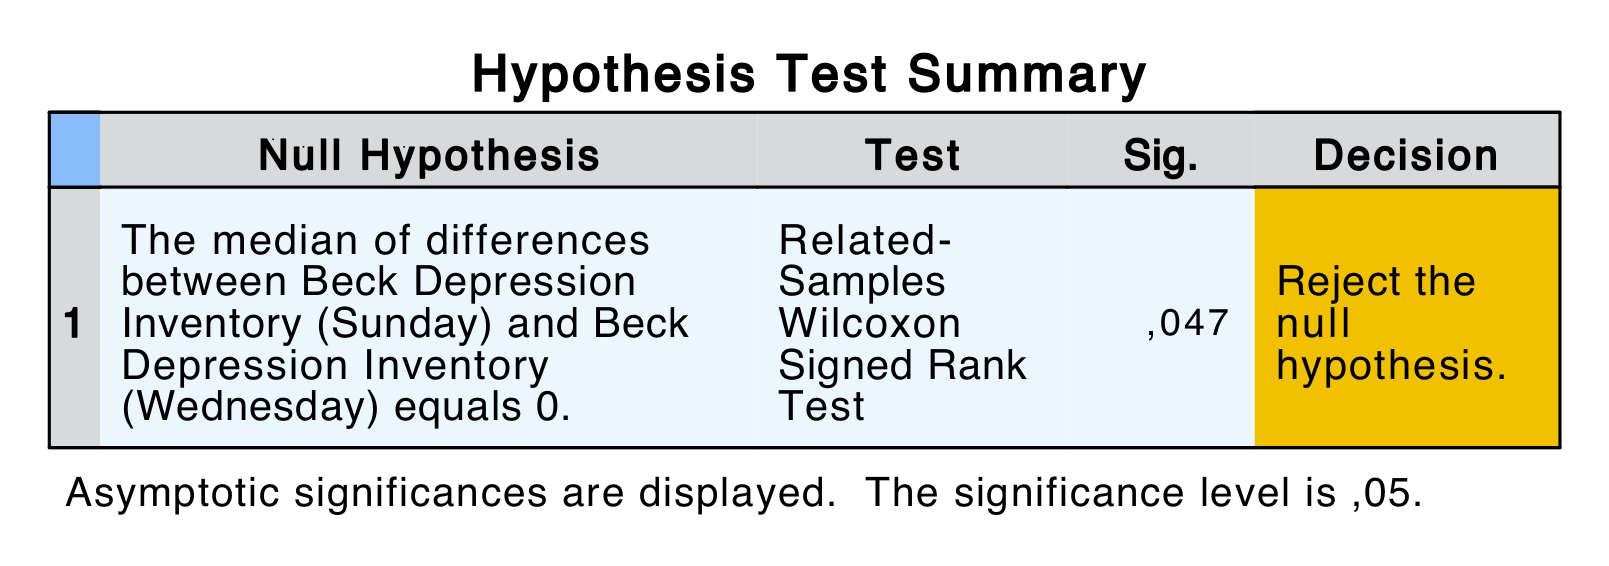
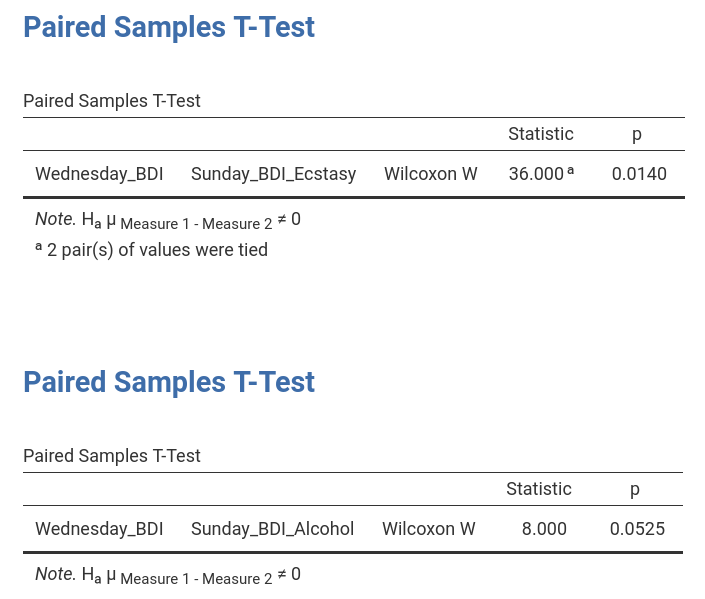
Comparisons of the output show that the results in SPSS and jamovi are slightly different. |
|
|
|
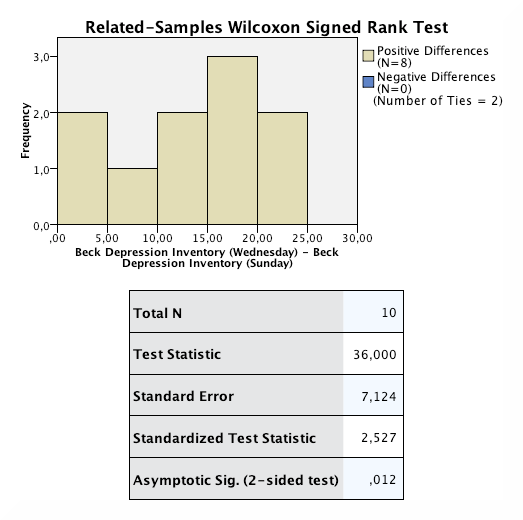
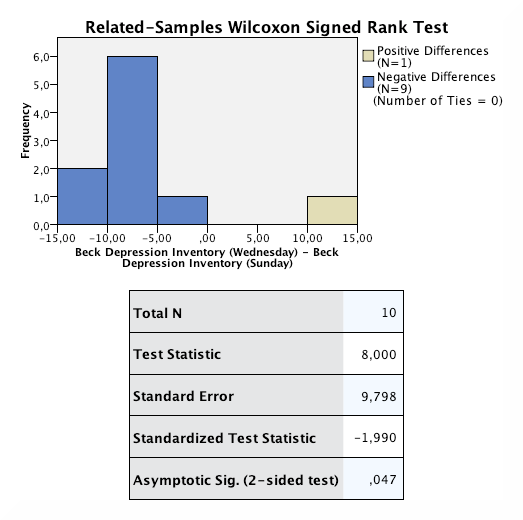
In SPSS, the first output table is the model summary, which only shows the
p-value for the test. If you double-click this table, you get the details
of the analysis (see images underneath). There are two model summaries, on
for each drug condition. The Wilcoxon Signed Rank test show the following
values: |
Other than SPSS, the |
|
|
When comparing the output, none of the numerical values for the test statistic are the same. The reason for the difference in p-values is that jamovi applies continuity correction (where a discrete distribution – ranks – is approximated via a continuous one – the standard normal distribution) whereas SPSS doesn’t. |
|
If you wish to replicate those analyses using syntax, you can use the commands below (in jamovi, just copy to code below to Rj). Alternatively, you can download the SPSS output files and the jamovi files with the analyses from below the syntax. |
|
NPTESTS
   /RELATED TEST(Sunday_BDI Wednesday_BDI) WILCOXON
   /MISSING SCOPE=ANALYSIS USERMISSING=EXCLUDE
   /CRITERIA ALPHA=0.05 CILEVEL=95.
|
jmv::ttestPS(
    data = data,
    pairs = list(
        list(i1 = "Wednesday_BDI", i2 = "Sunday_BDI_Ecstasy")),
    students = FALSE,
    wilcoxon = TRUE)

jmv::ttestPS(
    data = data,
    pairs = list(
        list(i1 = "Wednesday_BDI", i2 = "Sunday_BDI_Alcohol")),
    students = FALSE,
    wilcoxon = TRUE)
|