Section author: Rebecca Vederhus, Sebastian Jentschke
From SPSS to jamovi: Analysis of Covariance (ANCOVA)
This comparison shows how to test the assumption of homogeneity of regression slopes in SPSS and jamovi. The SPSS test follows the description in chapter 13.7 in Field (2017), especially figure 13.9 and output 13.12. It uses the data set Puppy Love Dummy.sav which can be downloaded from the web page accompanying the book.
SPSS |
jamovi |
|---|---|
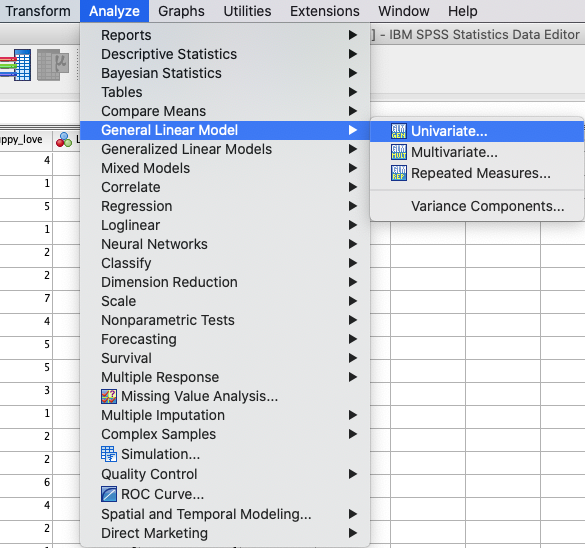
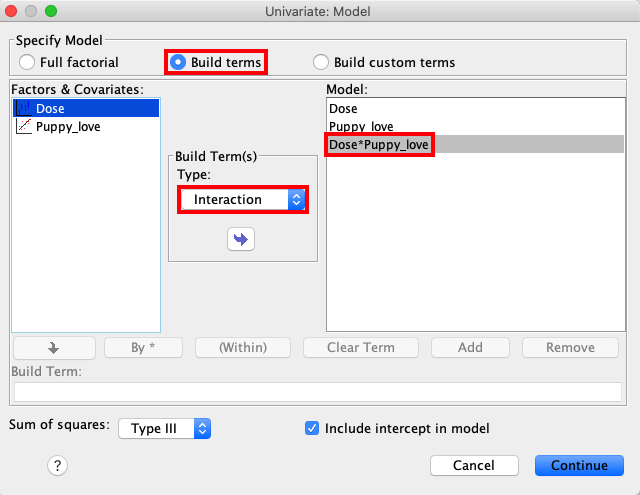
In SPSS, you can run this test using: |
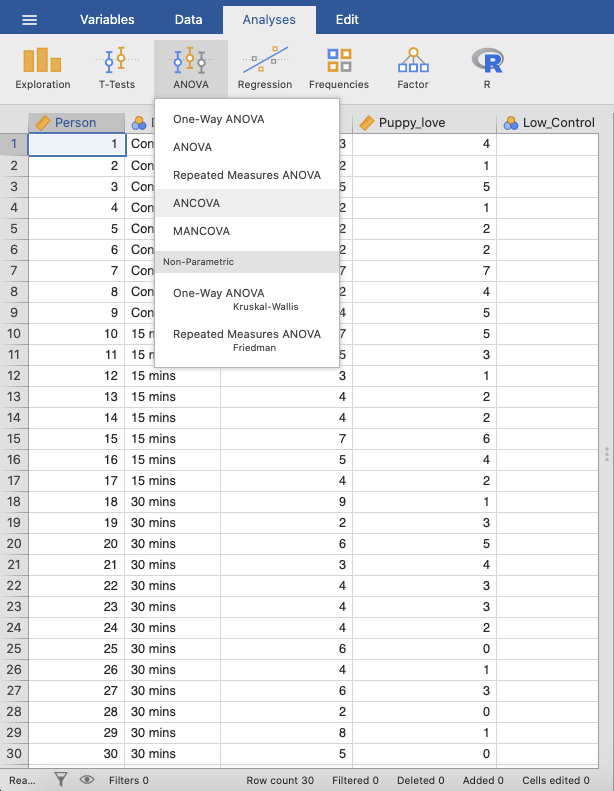
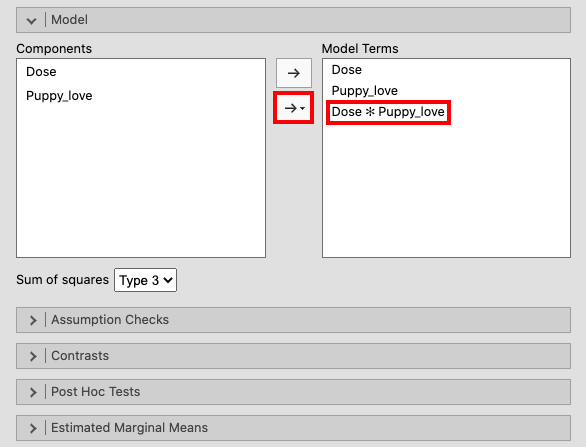
In jamovi you do this using: |
|
|
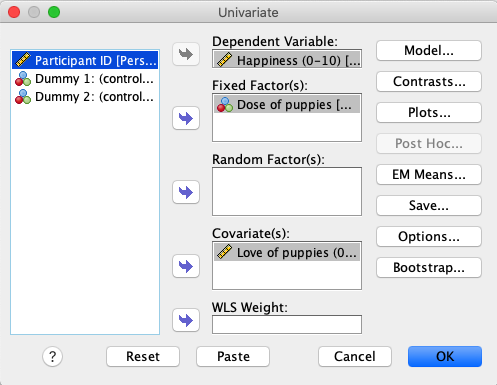
In SPSS, move |
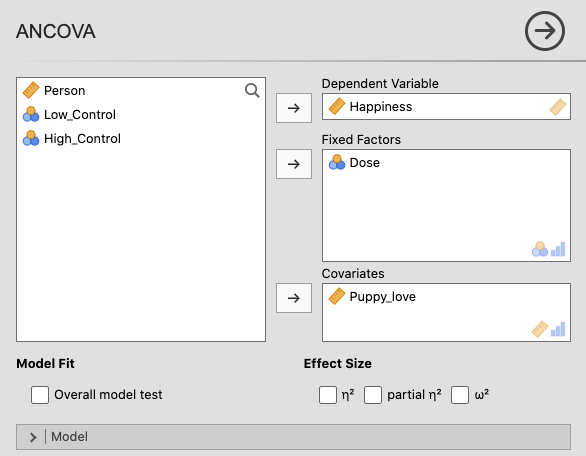
In jamovi, move the |
|
|
Access the |
Next, open the |
|
|
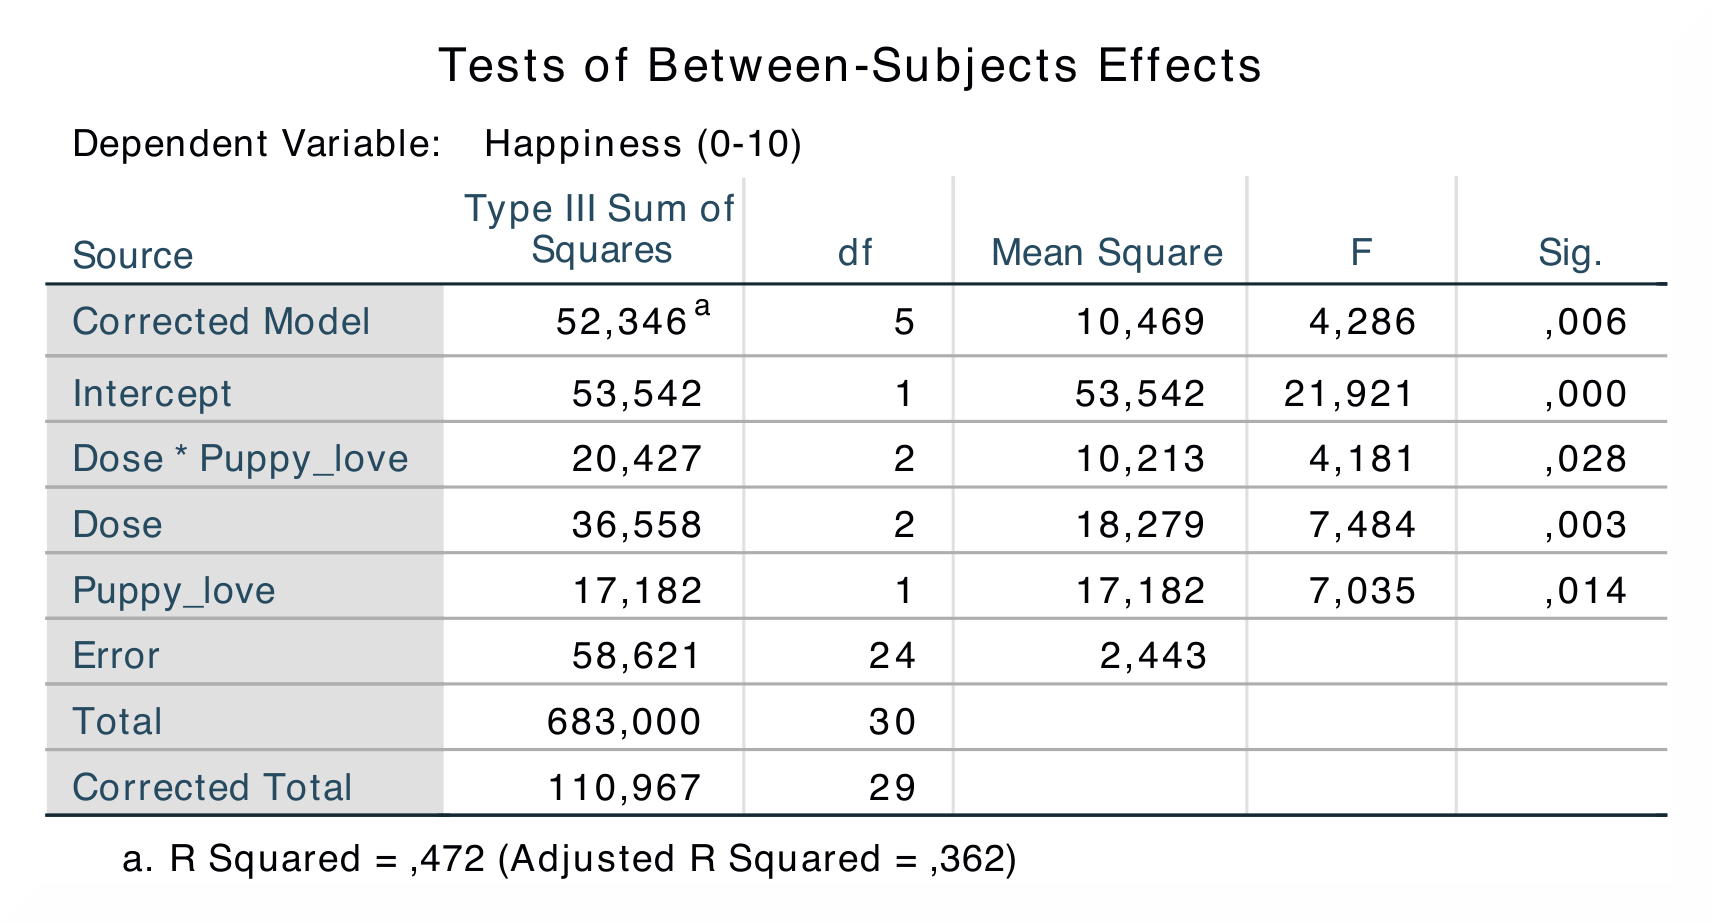
Comparisons between the output in SPSS and jamovi shows that the results are the same. |
|
|
|
In SPSS, the |
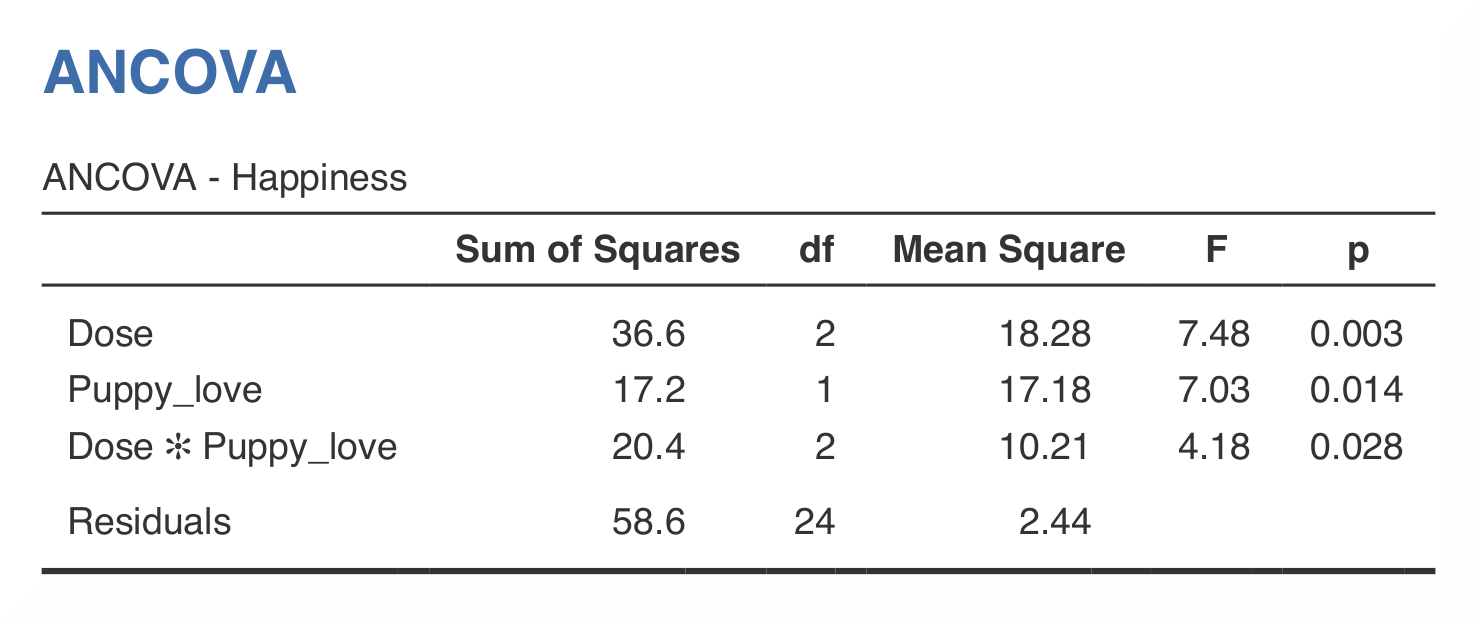
In jamovi, these results are found in a similar |
The main difference between the results in SPSS and jamovi is that SPSS provides values for the following: If one compares the numerical values, they are the same: SS*<sub>Dose</sub> = 36.6, *p < .01; SS*<sub>Puppy_love</sub> = 17.2, *p < .05; SS*<sub>Dose * Puppy_love</sub> = 20.4, *p < .05. |
|
If you wish to replicate those analyses using syntax, you can use the commands below (in jamovi, just copy to code below to Rj). Alternatively, you can download the SPSS output files and the jamovi files with the analyses from below the syntax. |
|
UNIANOVA Happiness BY Dose WITH Puppy_love
  /METHOD=SSTYPE(3)
  /INTERCEPT=INCLUDE
  /CRITERIA=ALPHA(0.05)
  /DESIGN=Dose\*Puppy_love Dose Puppy_love.
|
jmv::ancova(
    formula = Happiness ~ Dose + Puppy_love + Dose:Puppy_love,
    data = data)
|