Section author: Rebecca Vederhus, Sebastian Jentschke
From SPSS to jamovi: Analysis of Covariance (ANCOVA)
This comparison shows how an analysis of covariance which excludes the covariate is conducted in SPSS and jamovi. The SPSS test follows the description in chapter 13.6.1 - 13.6.4 in Field (2017), especially figure 13.5 - 13.7 (excluding the covariate in figure 13.5 and
Optionsin figure 13.7) and output 13.5. It uses the data set Puppy Love.sav which can be downloaded from the web page accompanying the book.
SPSS |
jamovi |
|---|---|
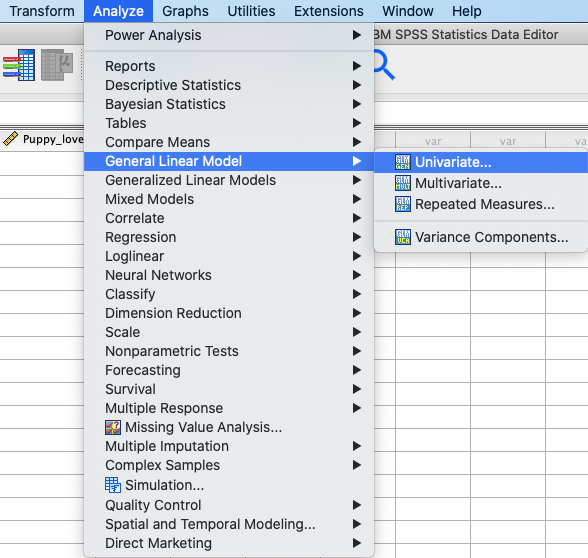
In SPSS, you can run this test using: |
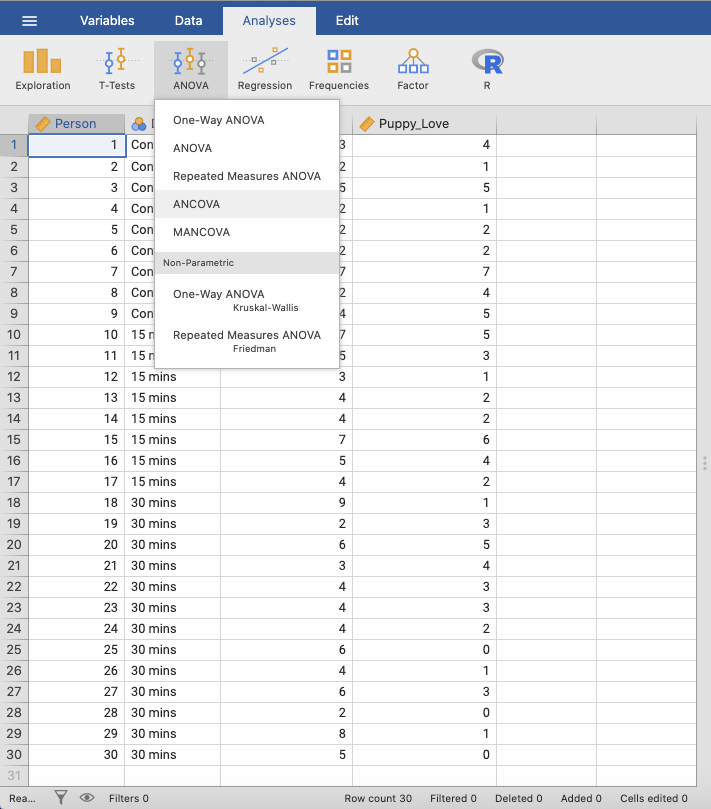
In jamovi, you can create an analysis of covariance using: |
|
|
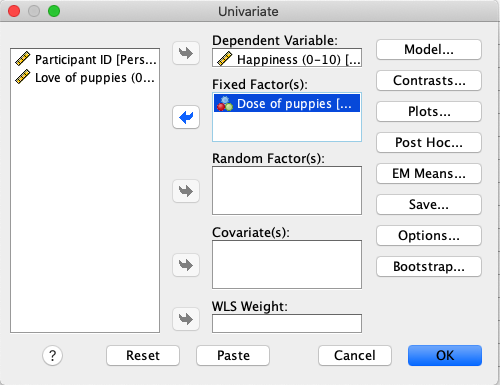
In SPSS, move |
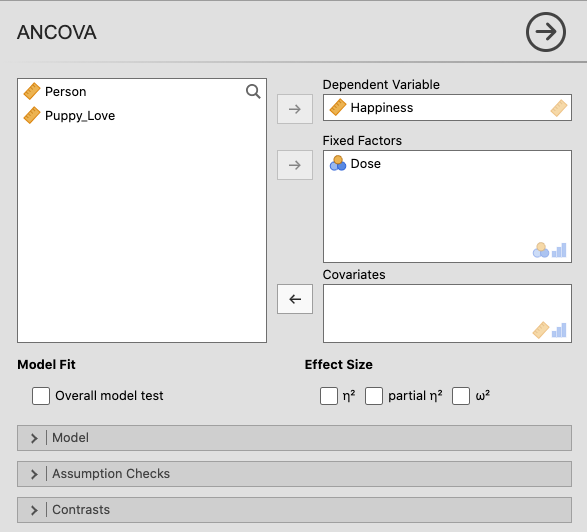
In jamovi, move |
|
|
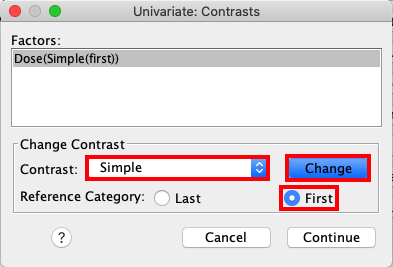
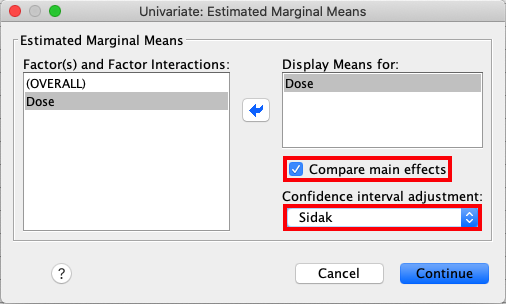
Open the dialog box called |
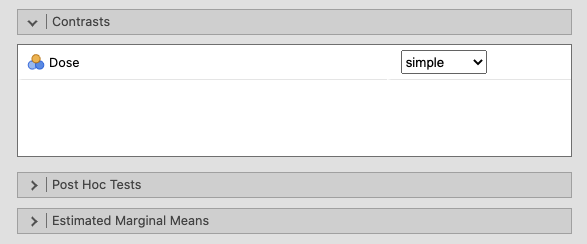
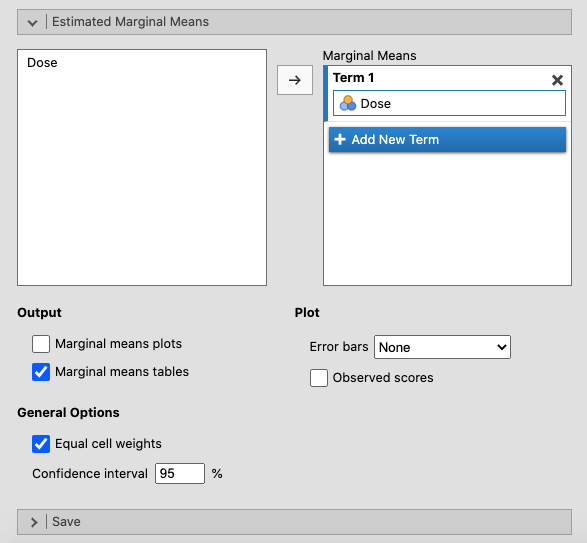
Open the |
|
|
Select |
In the |
|
|
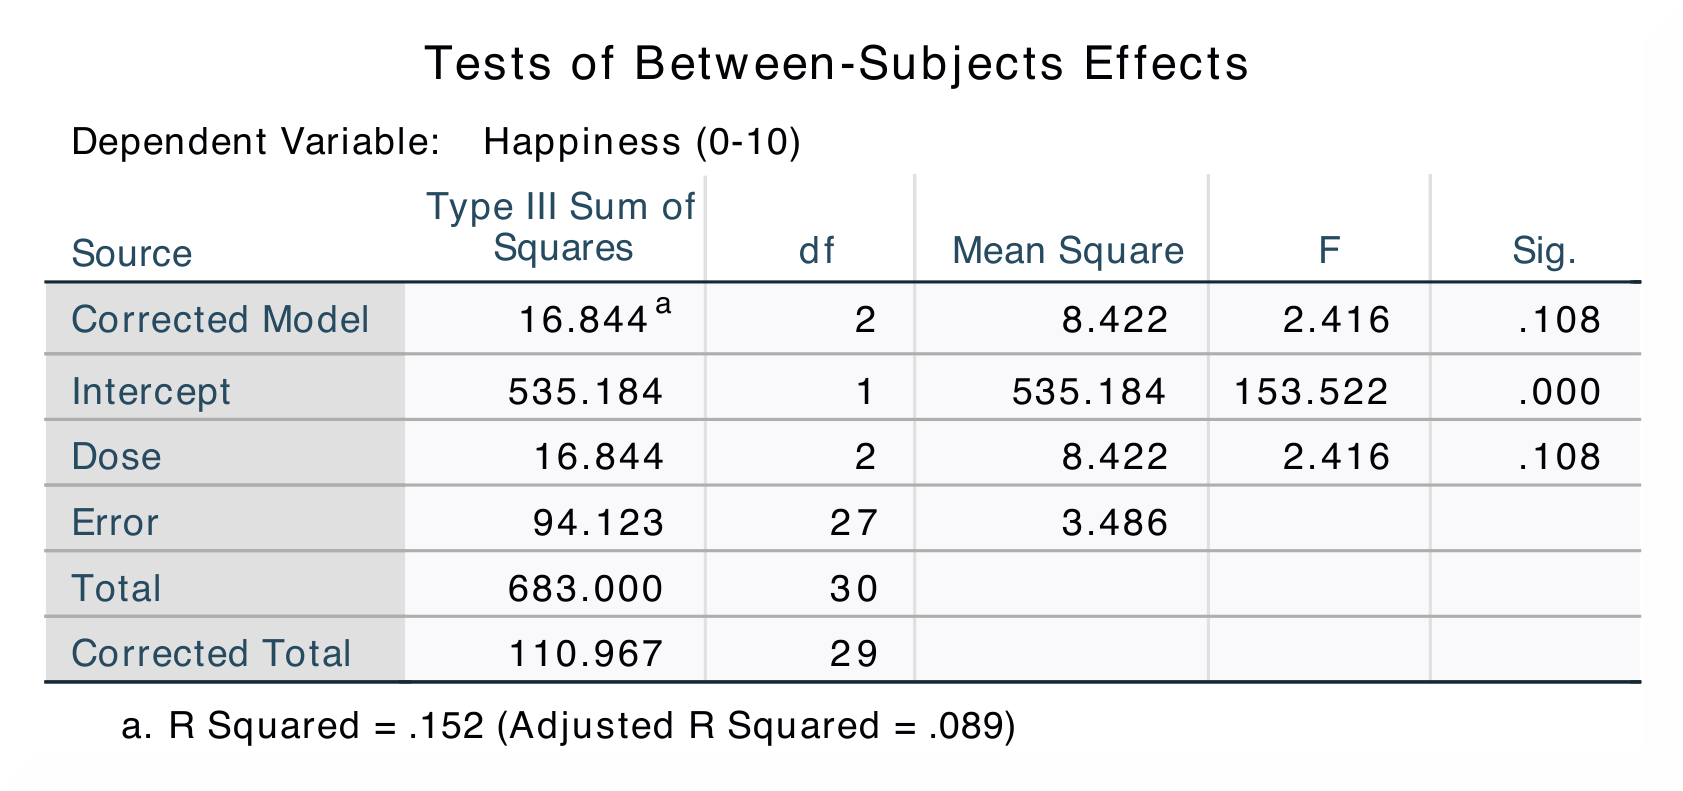
The results are essentially the same in SPSS and jamovi, except that SPSS provides more output tables than jamovi. |
|
|
|
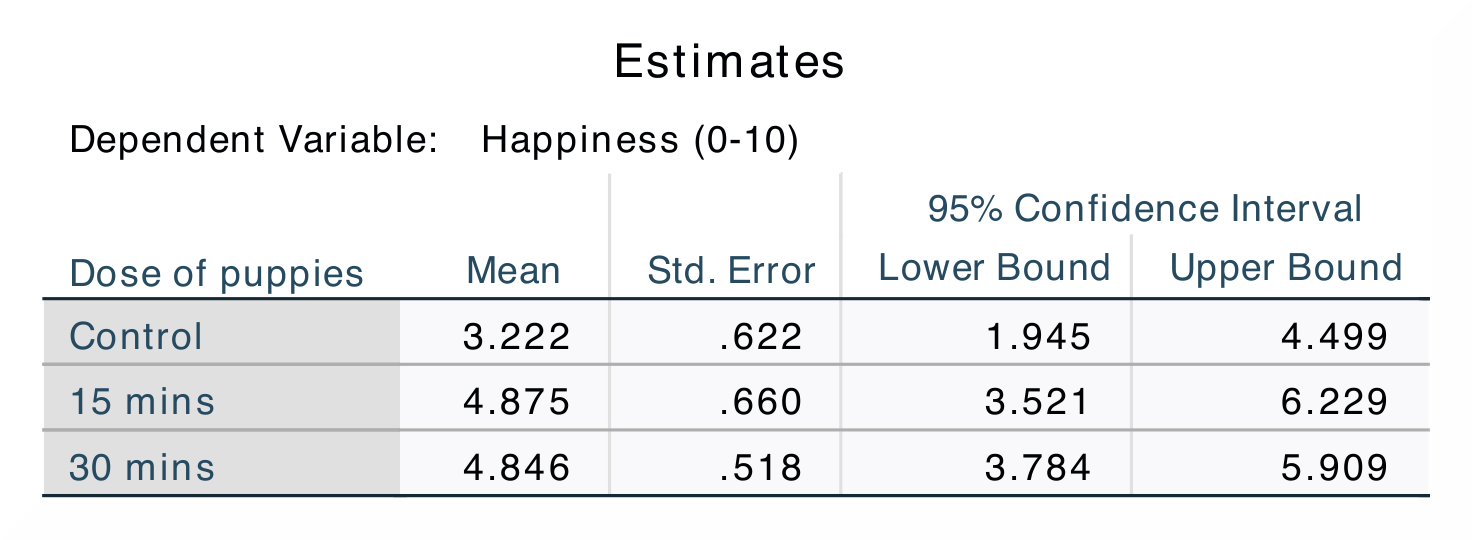
In SPSS, you can find the adjusted values of the group means in the
|
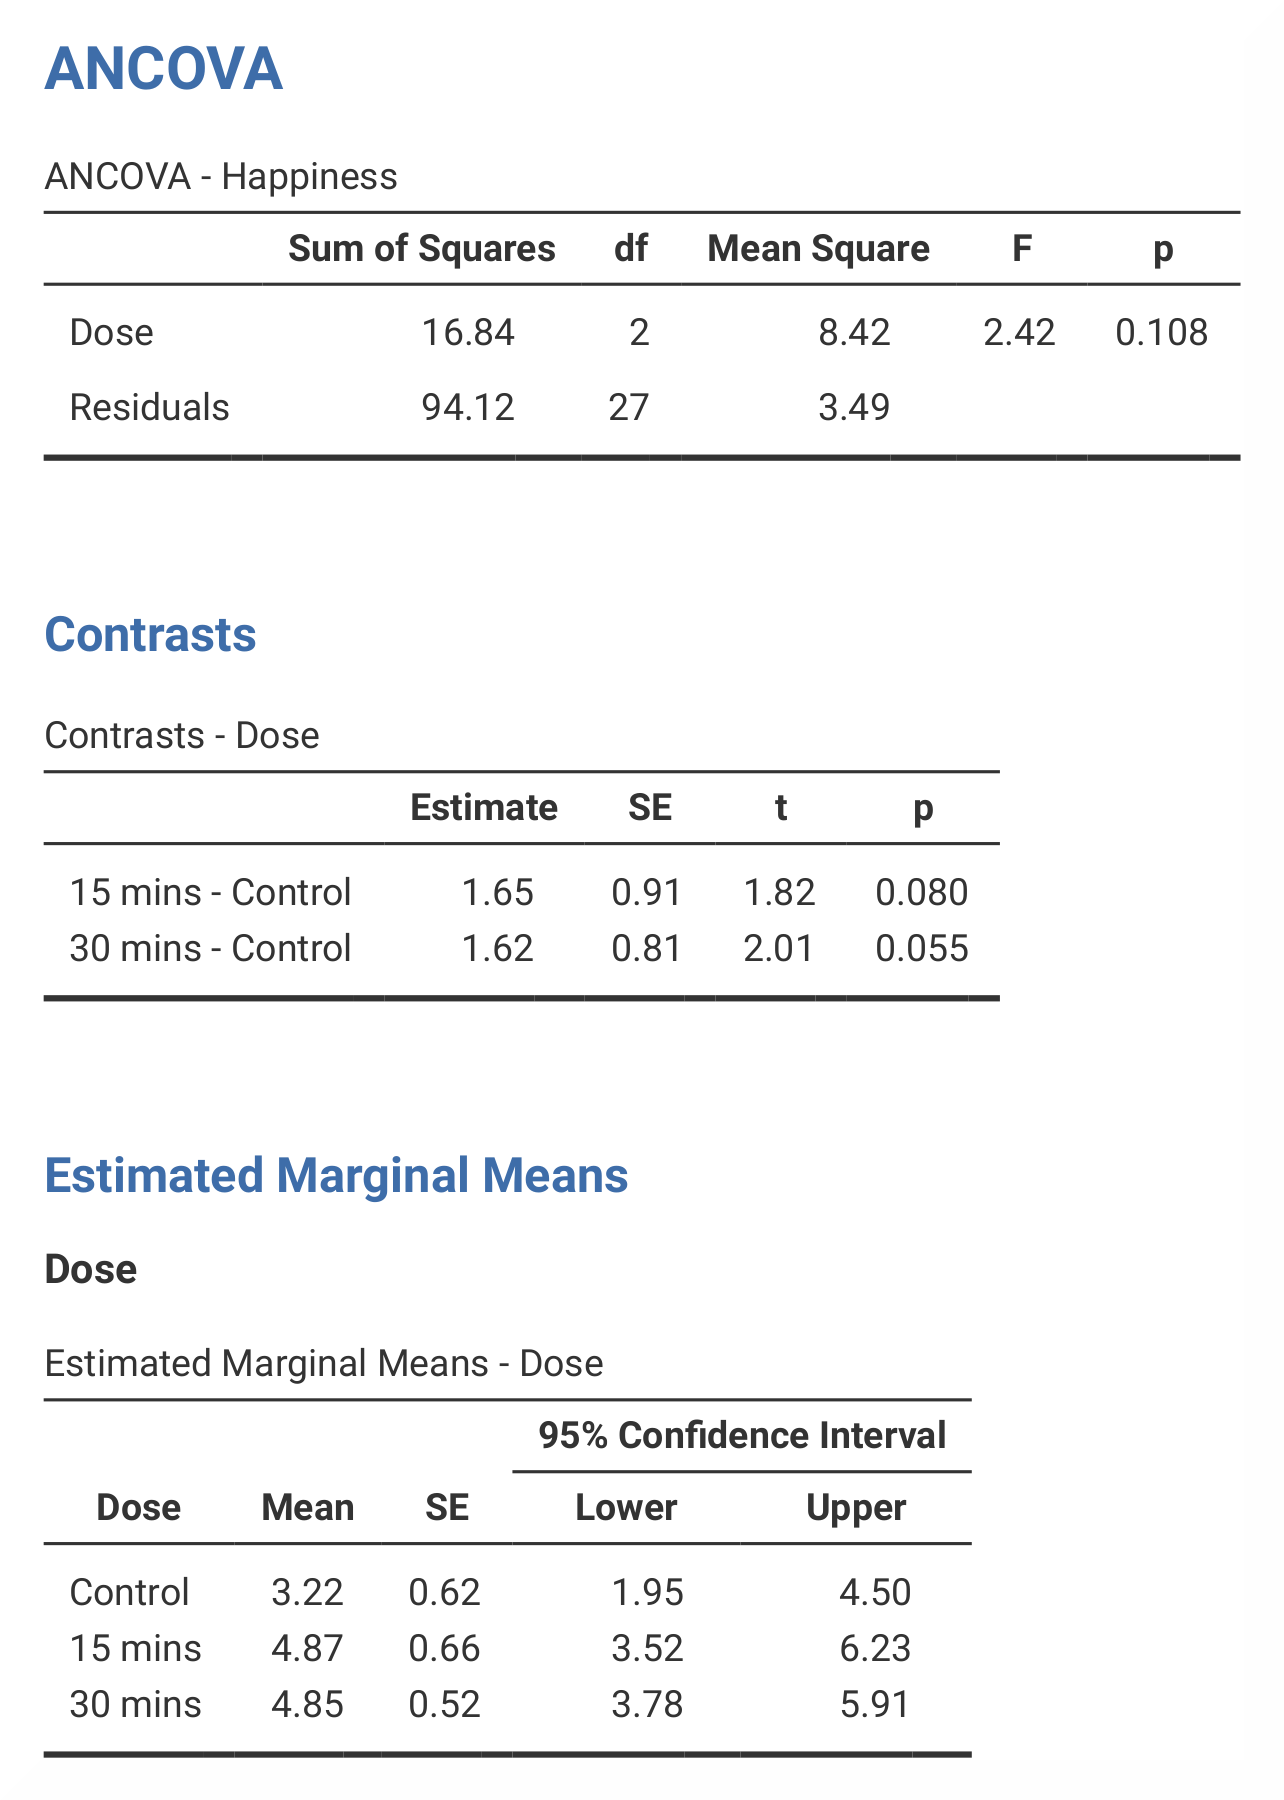
In jamovi, the adjusted values can be found in the table called |
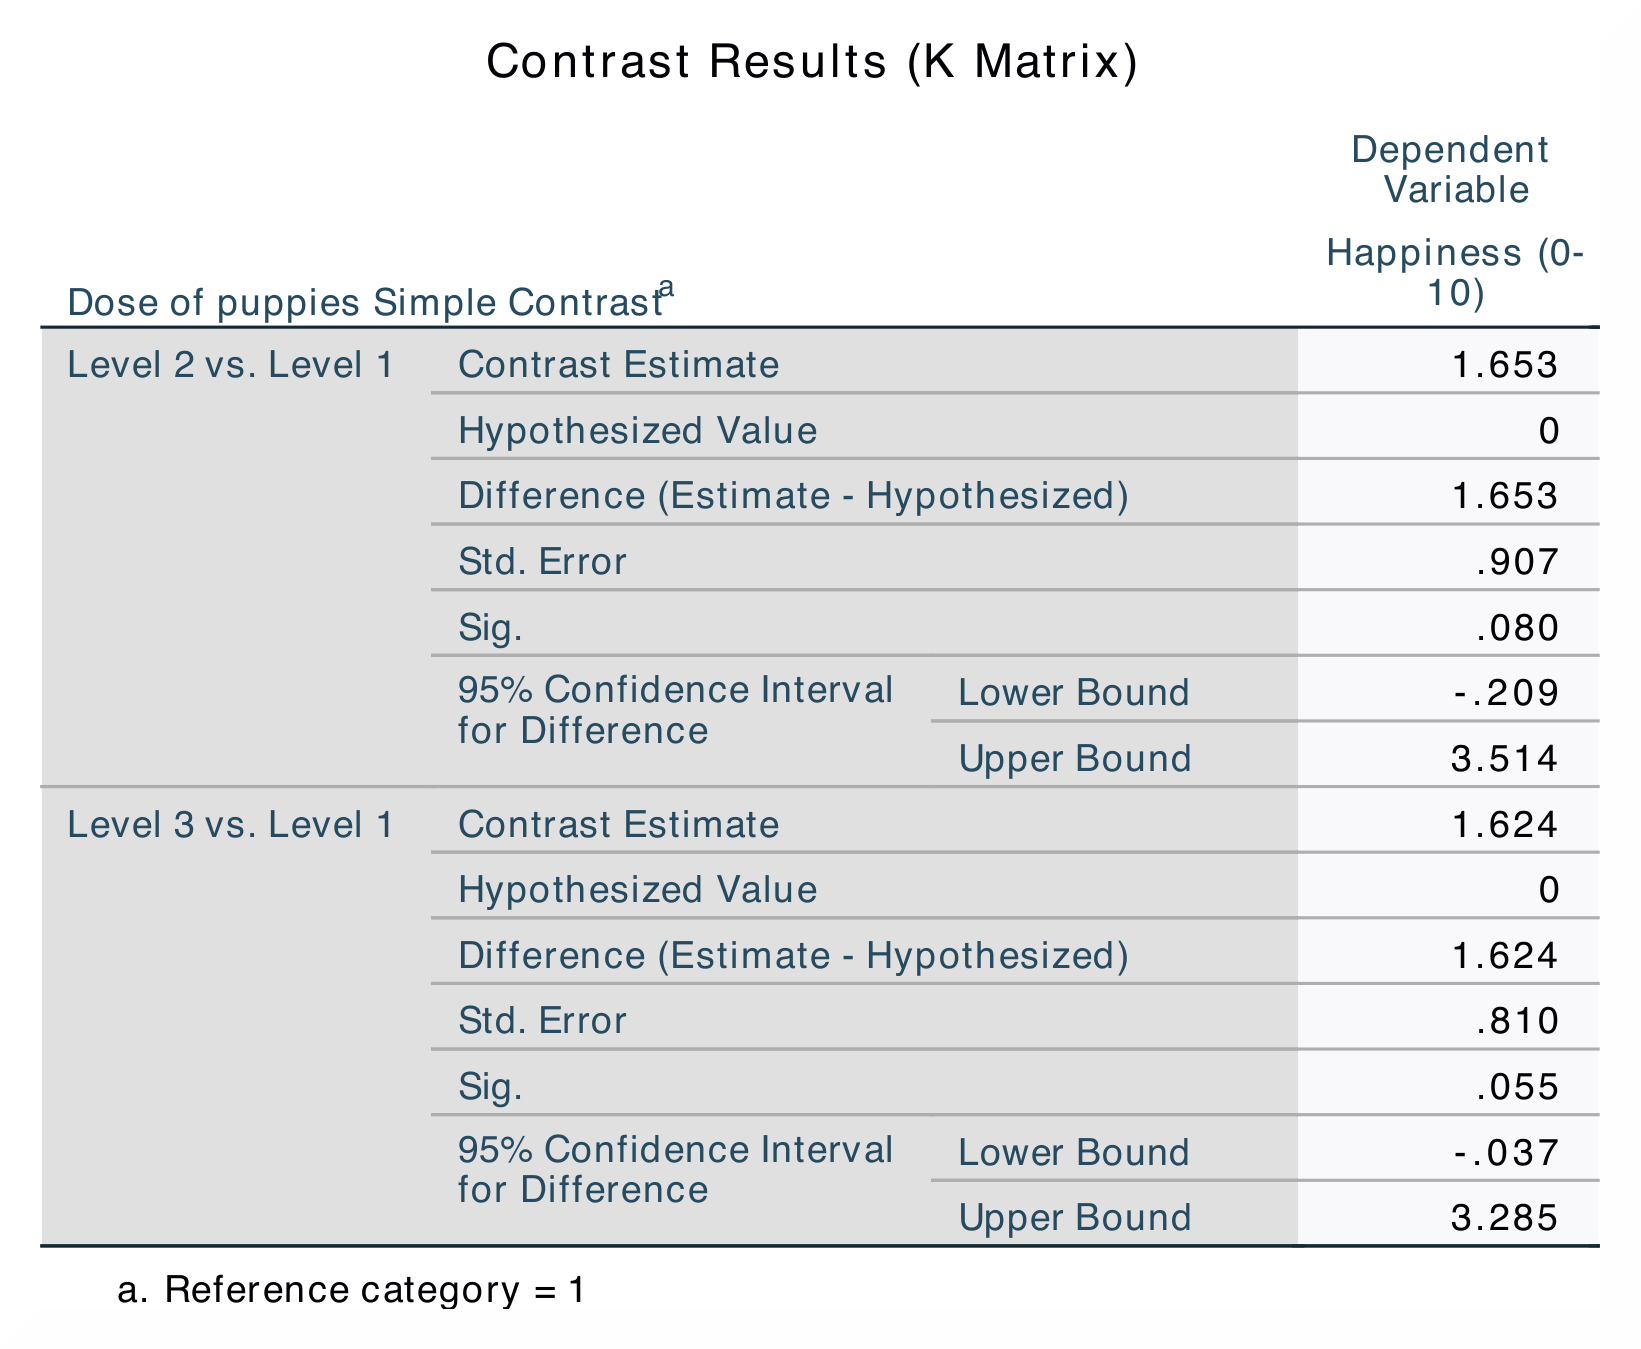
jamovi does not include the values for the The numerical values for these analyses are the same: SS*<sub>Dose</sub> = 16.84; *M*<sub>Control</sub> = 3.22, *M*<sub>15mins</sub> = 4.87, *M*<sub>30mins</sub> = 4.85; contrast 1, *p = 0.080; contrast 2, p = 0.055. |
|
If you wish to replicate those analyses using syntax, you can use the commands below (in jamovi, just copy to code below to Rj). Alternatively, you can download the SPSS output files and the jamovi files with the analyses from below the syntax. |
|
UNIANOVA Happiness BY Dose
  /CONTRAST(Dose)=Simple(1)
  /METHOD=SSTYPE(3)
  /INTERCEPT=INCLUDE
  /EMMEANS=TABLES(Dose) COMPARE ADJ(SIDAK)
  /CRITERIA=ALPHA(0.05)
  /DESIGN=Dose.
|
jmv::ancova(
    formula = Happiness ~ Dose,
    data = data,
    contrasts = list(list(var = "Dose", type = "simple")),
    emMeans = ~ Dose,
    emmPlots = FALSE,
    emmPlotError = "none",
    emmTables = TRUE)
|