Section author: Rebecca Vederhus, Sebastian Jentschke
From SPSS to jamovi: Correlation
This comparison shows how a semi-partial (or partial) correlation is conducted in SPSS and jamovi. The SPSS test follows the description in chapter 8.5.3 in Field (2017), especially figure 8.11 and output 8.5. It uses the data set Exam Anxiety.sav which can be downloaded from the web page accompanying the book.
SPSS |
jamovi |
|---|---|
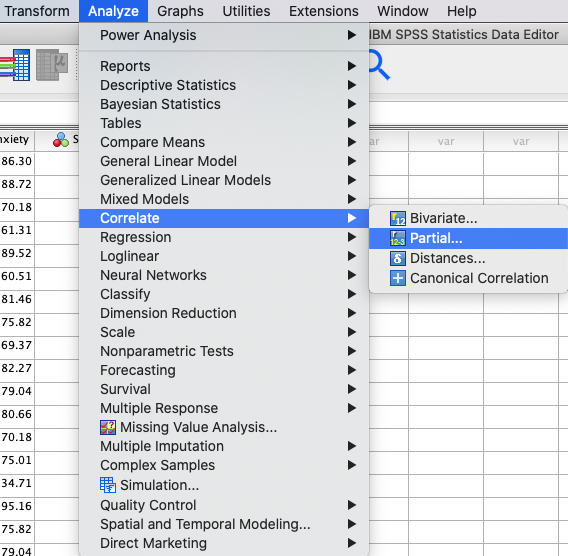
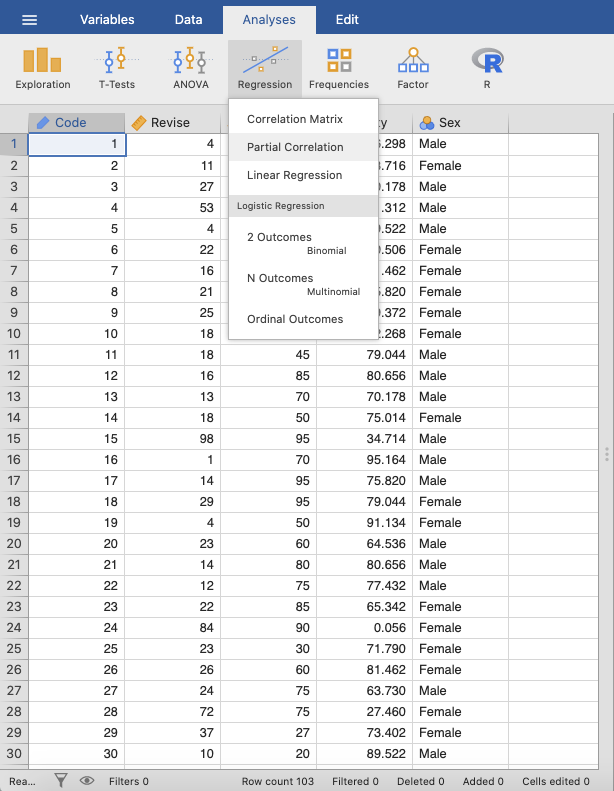
In SPSS you can run a partial correlation using: |
In jamovi you do this using: |
|
|
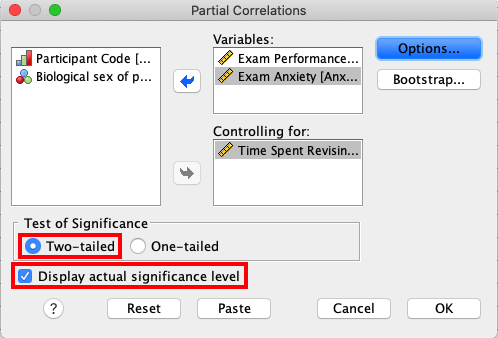
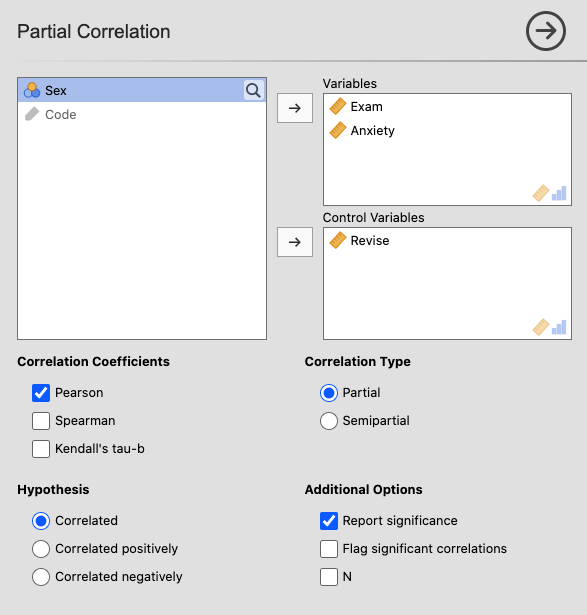
In SPSS, move the variables |
In jamovi, move the variables |
|
|
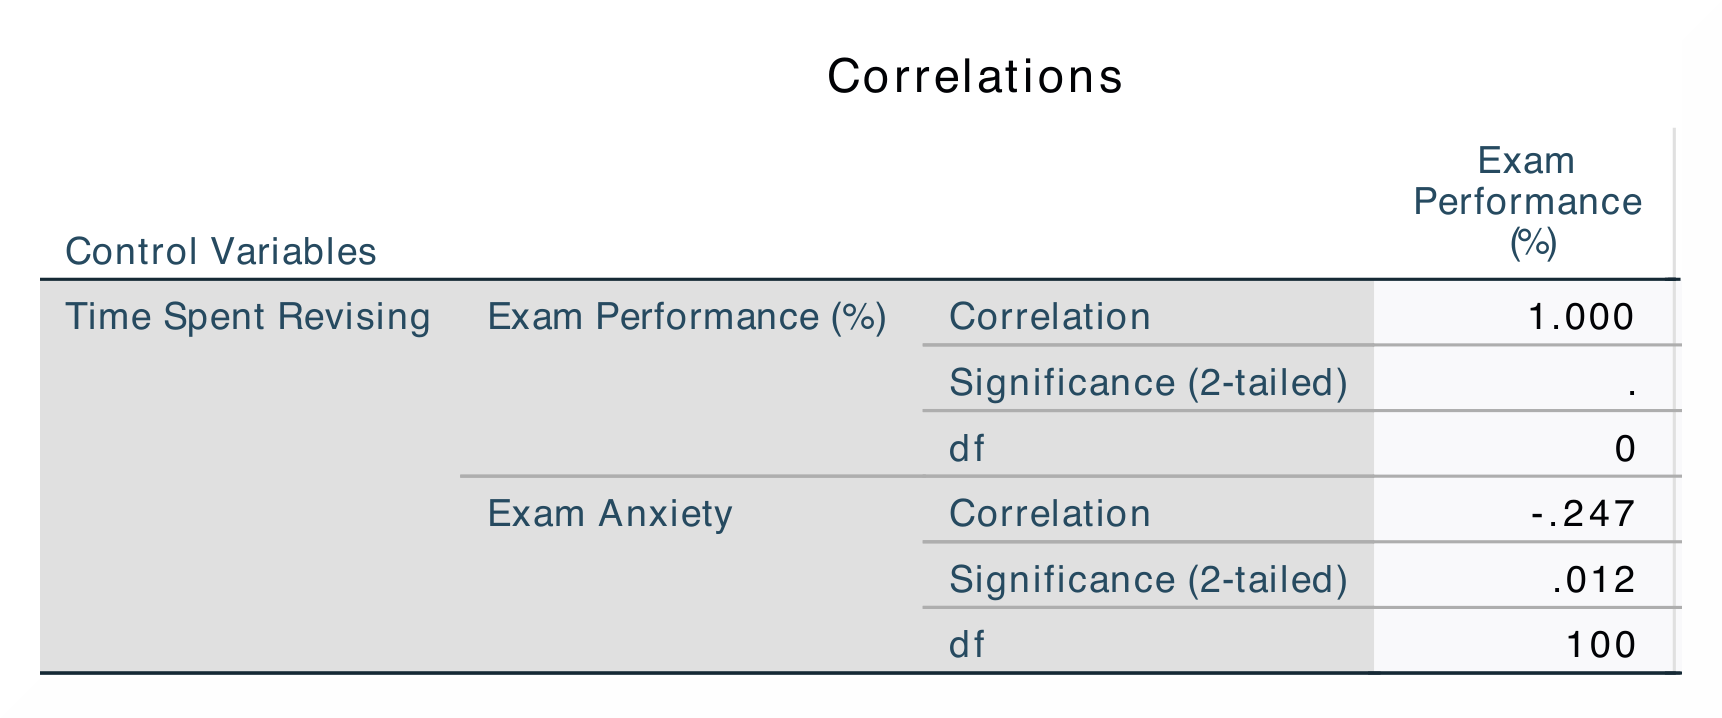
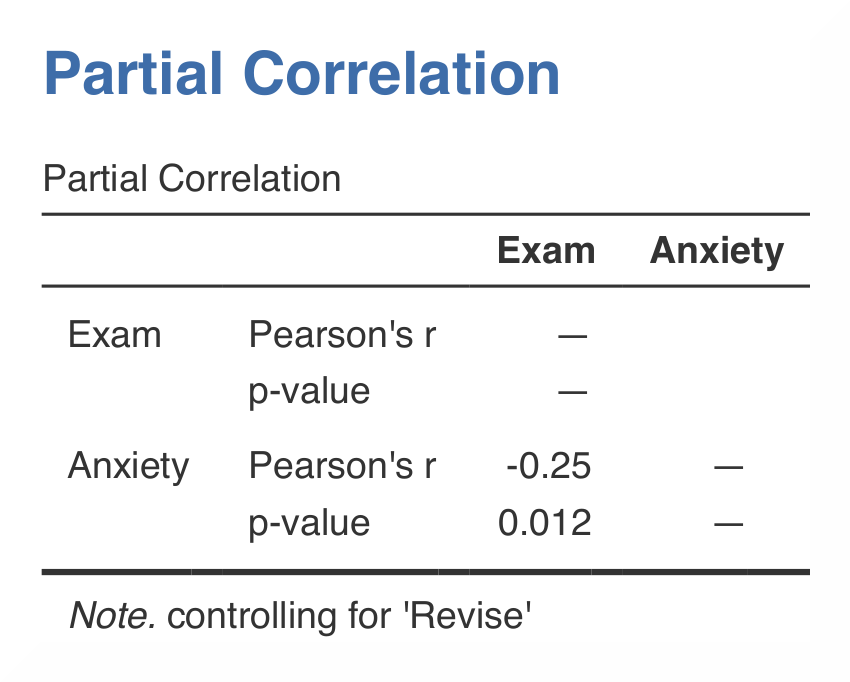
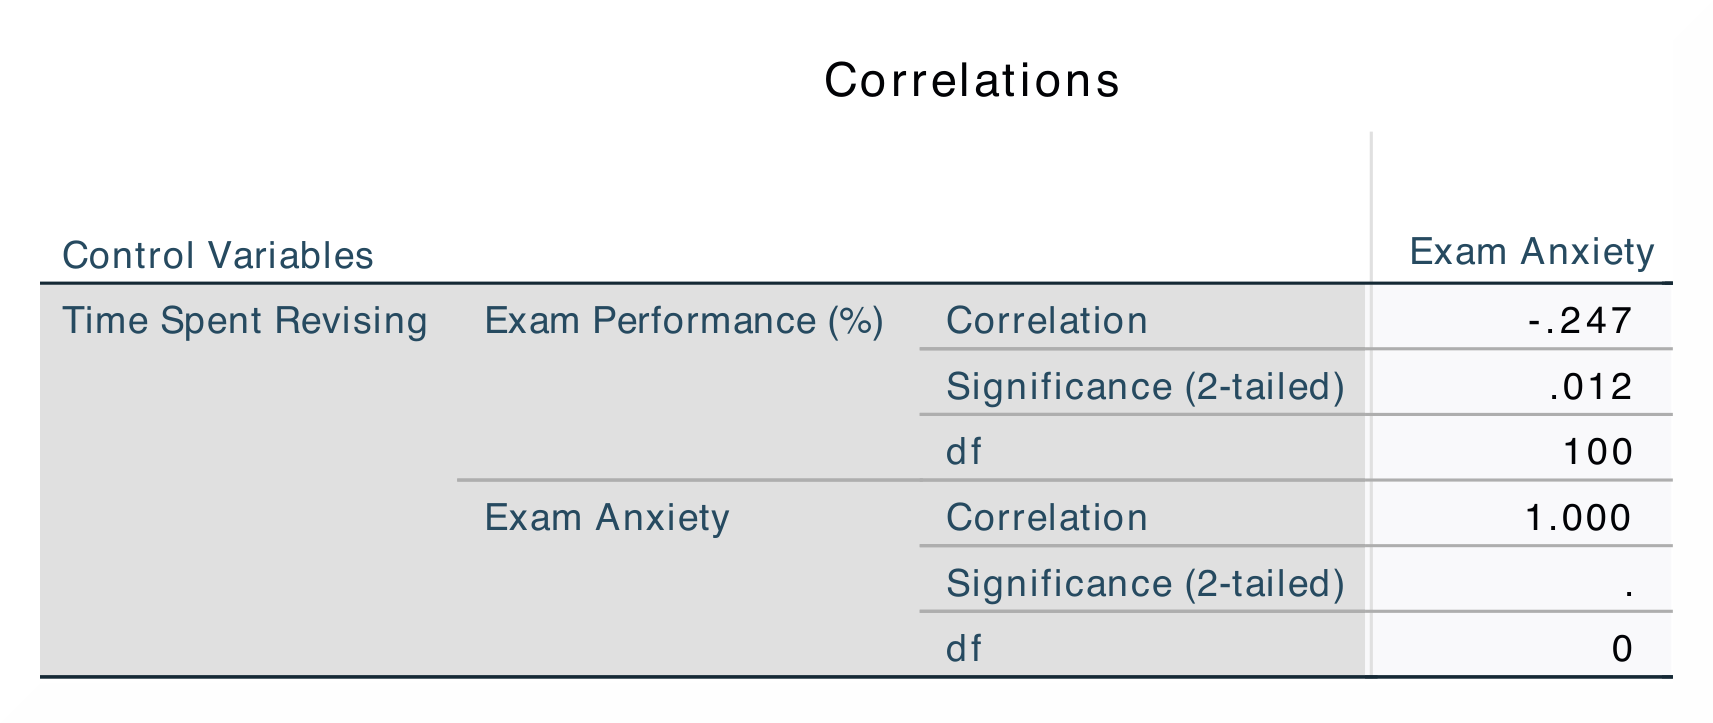
The results are the same in SPSS and in jamovi. |
|
|
|
|
|
In SPSS, you can tell if a correlation is significant by noting the amount of asterisks after the correlation coefficient. The correlation matrix shows the correlation coefficient, the p-value, and the sample size (N). |
In jamovi, significant correlations are flagged using one (p < .05), two (p < .01) or three (p < .001) asterisks. This differs from SPSS, where all correlation above p < .01 level is simply marked using two instead of three asterisks. |
Results are presented twice in SPSS, while in jamovi they are only presented once. The numerical values for the statistics are identical: r = -.25. |
|
If you wish to replicate those analyses using syntax, you can use the commands below (in jamovi, just copy to code below to Rj). Alternatively, you can download the SPSS output files and the jamovi files with the analyses from below the syntax. |
|
PARTIAL CORR
  /VARIABLES=Exam Anxiety BY Revise
  /SIGNIFICANCE=TWOTAIL
  /MISSING=LISTWISE.
|
jmv::corrPart(
    data = data,
    vars = vars(Exam, Anxiety),
    controls = Revise)
|