Section author: Sebastian Jentschke
From SPSS to jamovi: t-test for paired samples
After having demonstrated the beneficial effect of repeated-measures-designs on the standard error of mean, we conduct a t-test for paired samples. Using this test,
we compare whether the number of mischieveous acts has increased after receiving a cloak of invisibility (variable Cloak) in comparison to the number of
mischieveous acts at baseline (variable No_Cloak). This analysis is described in chapter 10.9.3 of Field (2017), especially Figure 10.12 and Output 10.8 - 10.9.
We use the same data file Invisibility RM.sav which can be downloaded from the web page accompanying Andy Field’s book.
SPSS (version 27) |
jamovi (version 2.0) |
|---|---|
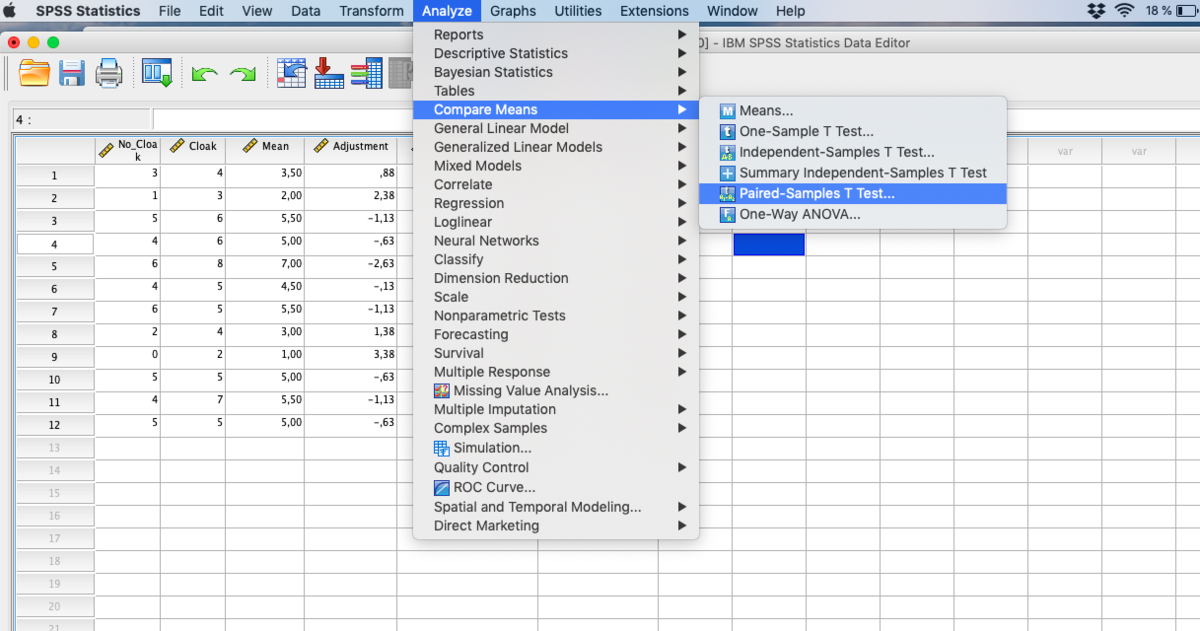
In SPSS you can set up a t-test for paired samples using: |
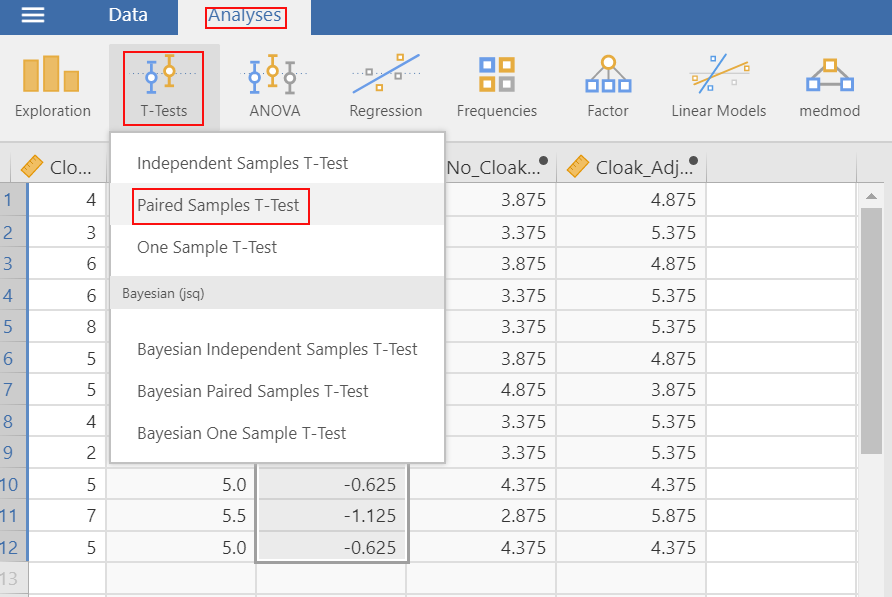
In jamovi you do this using: |
|
|
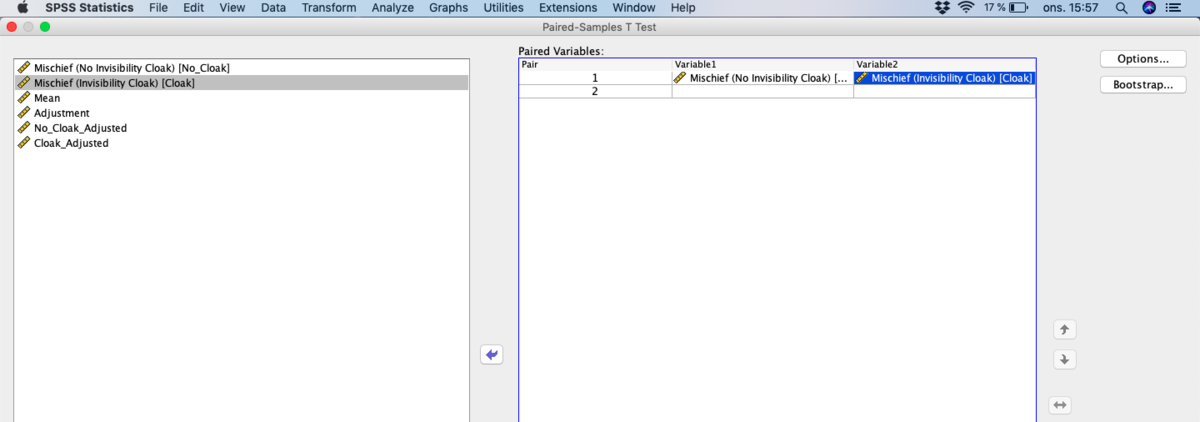
In the input window that opens, the two variables |
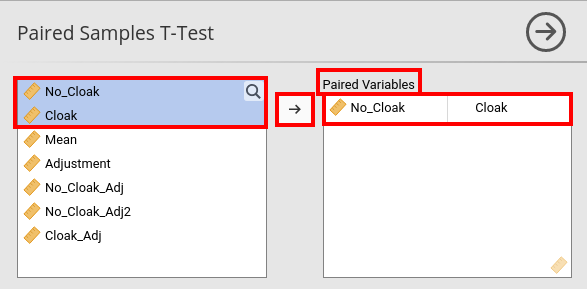
In the input panel that opens, the variables |
|
|
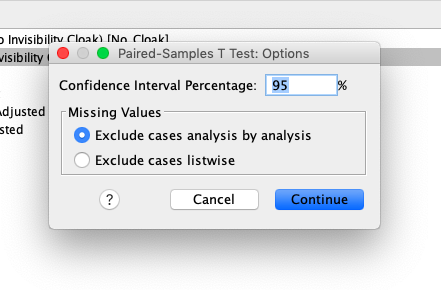
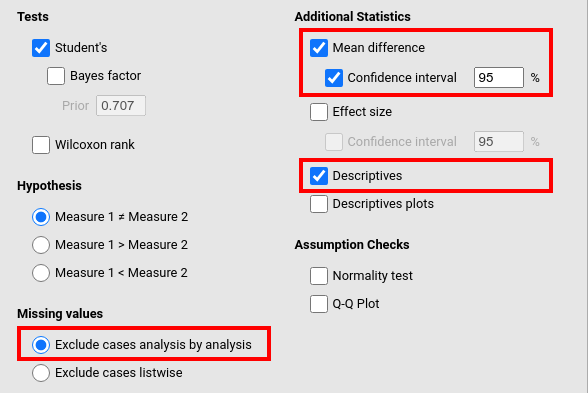
Afterwards, we press the |
In jamovi, do we go further down in the input panel and tick |
|
|
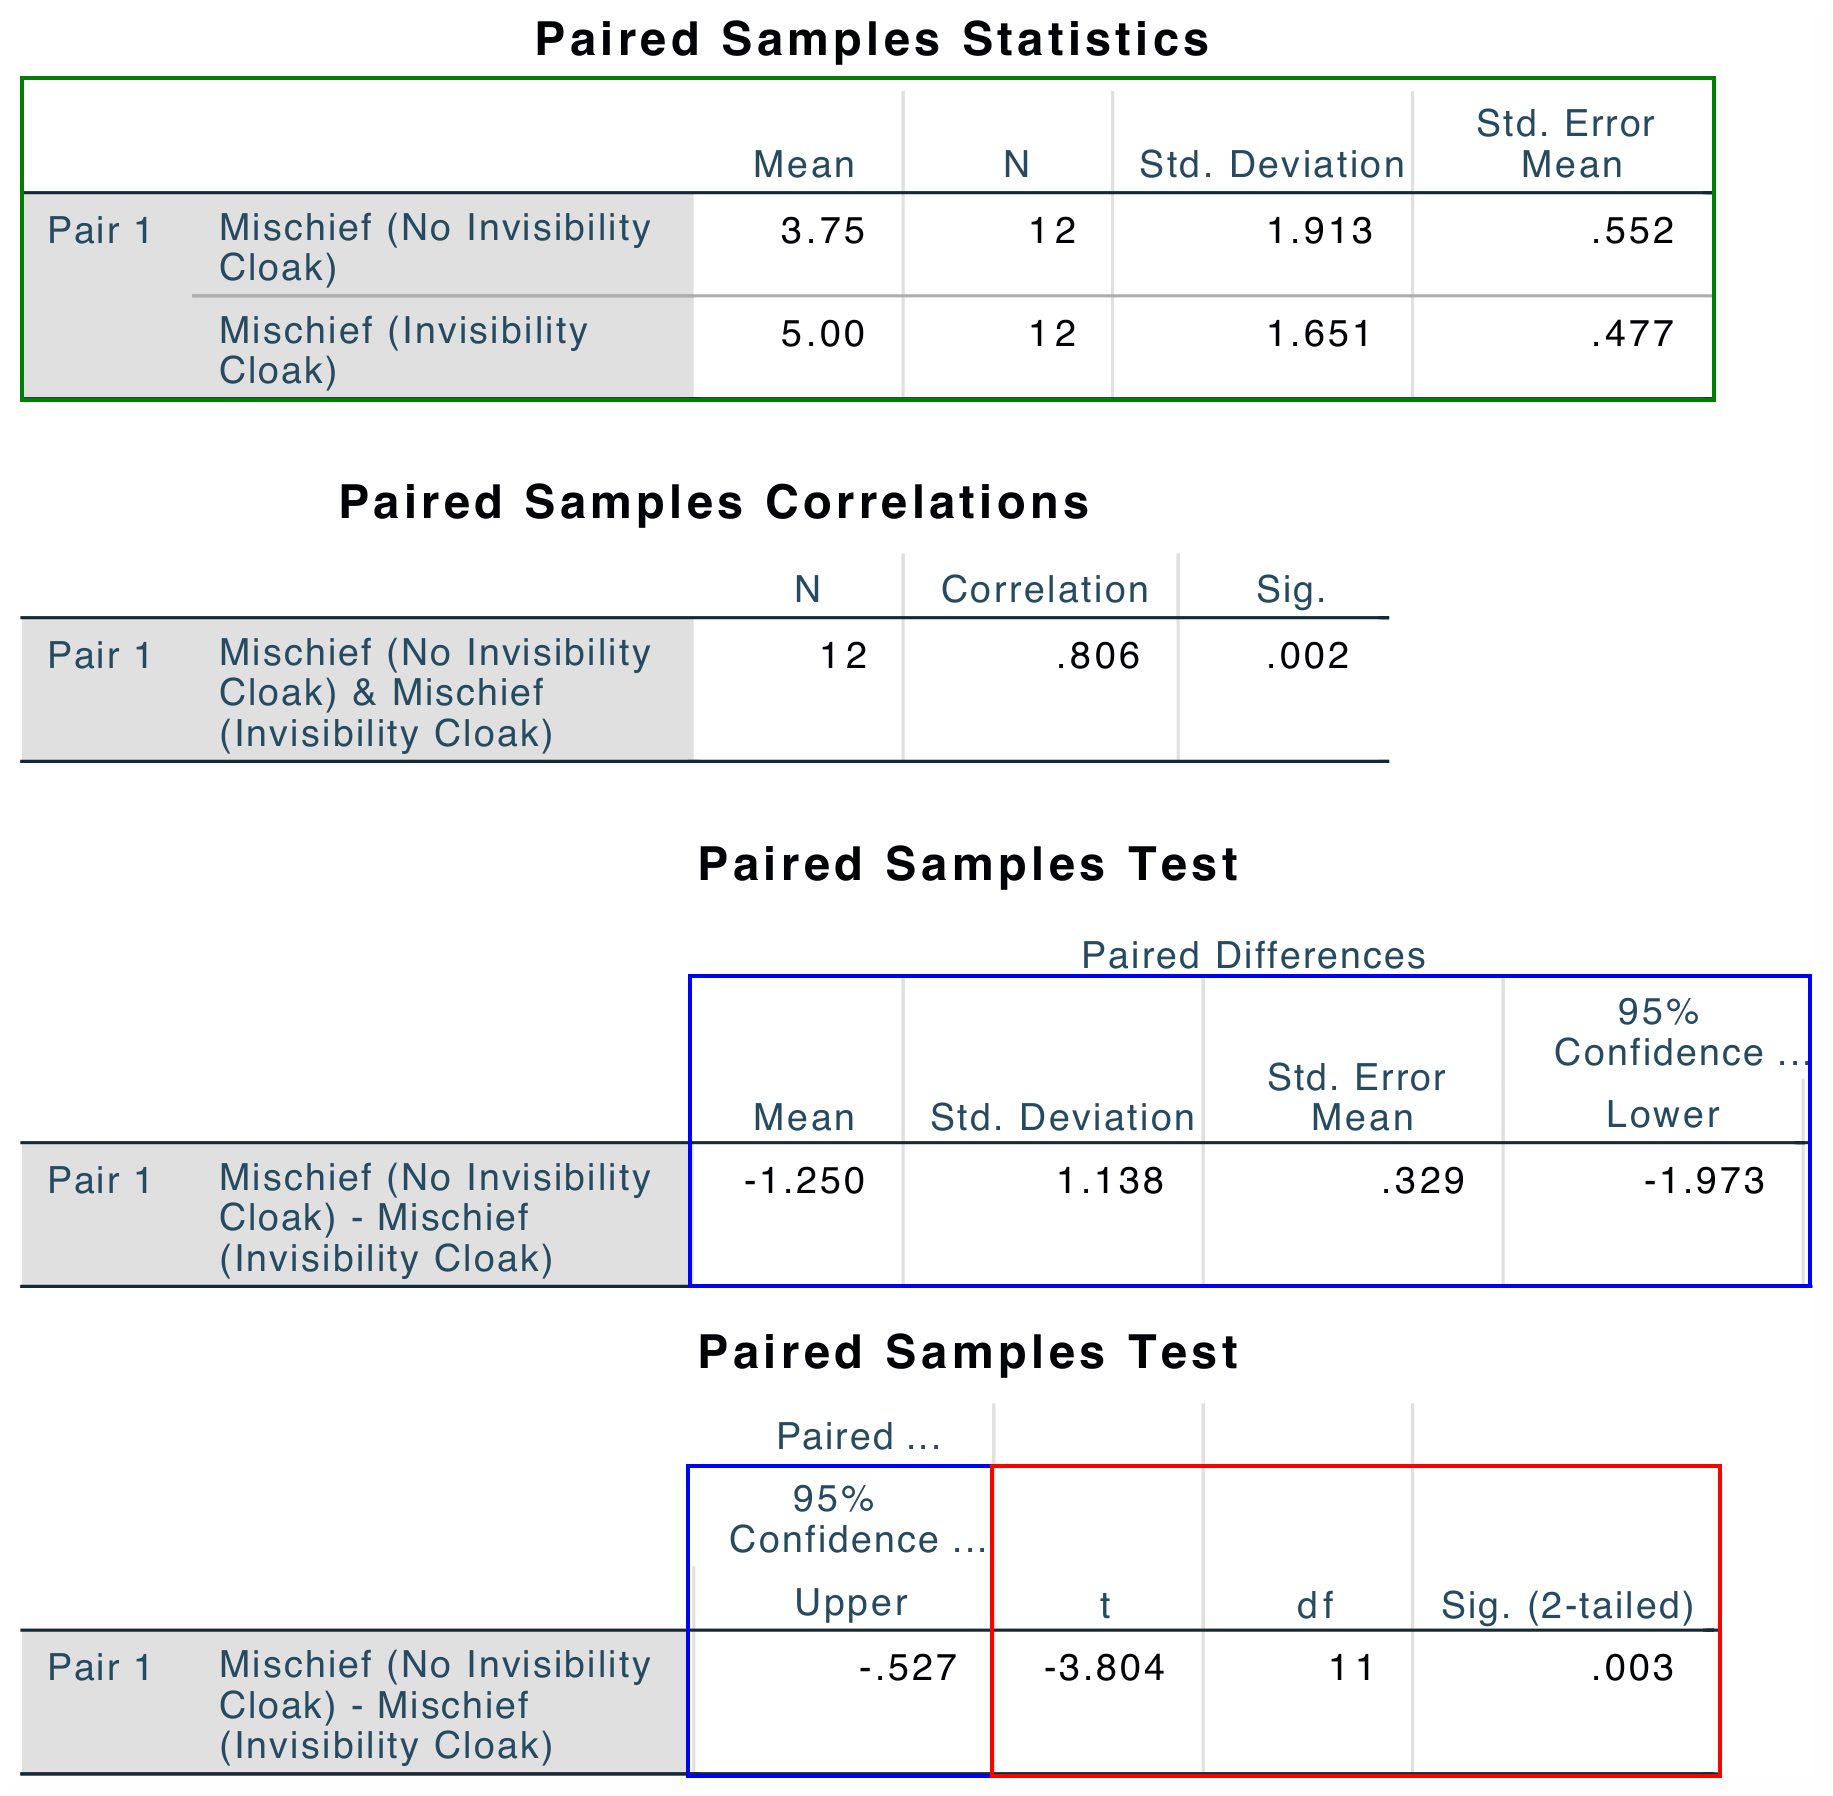
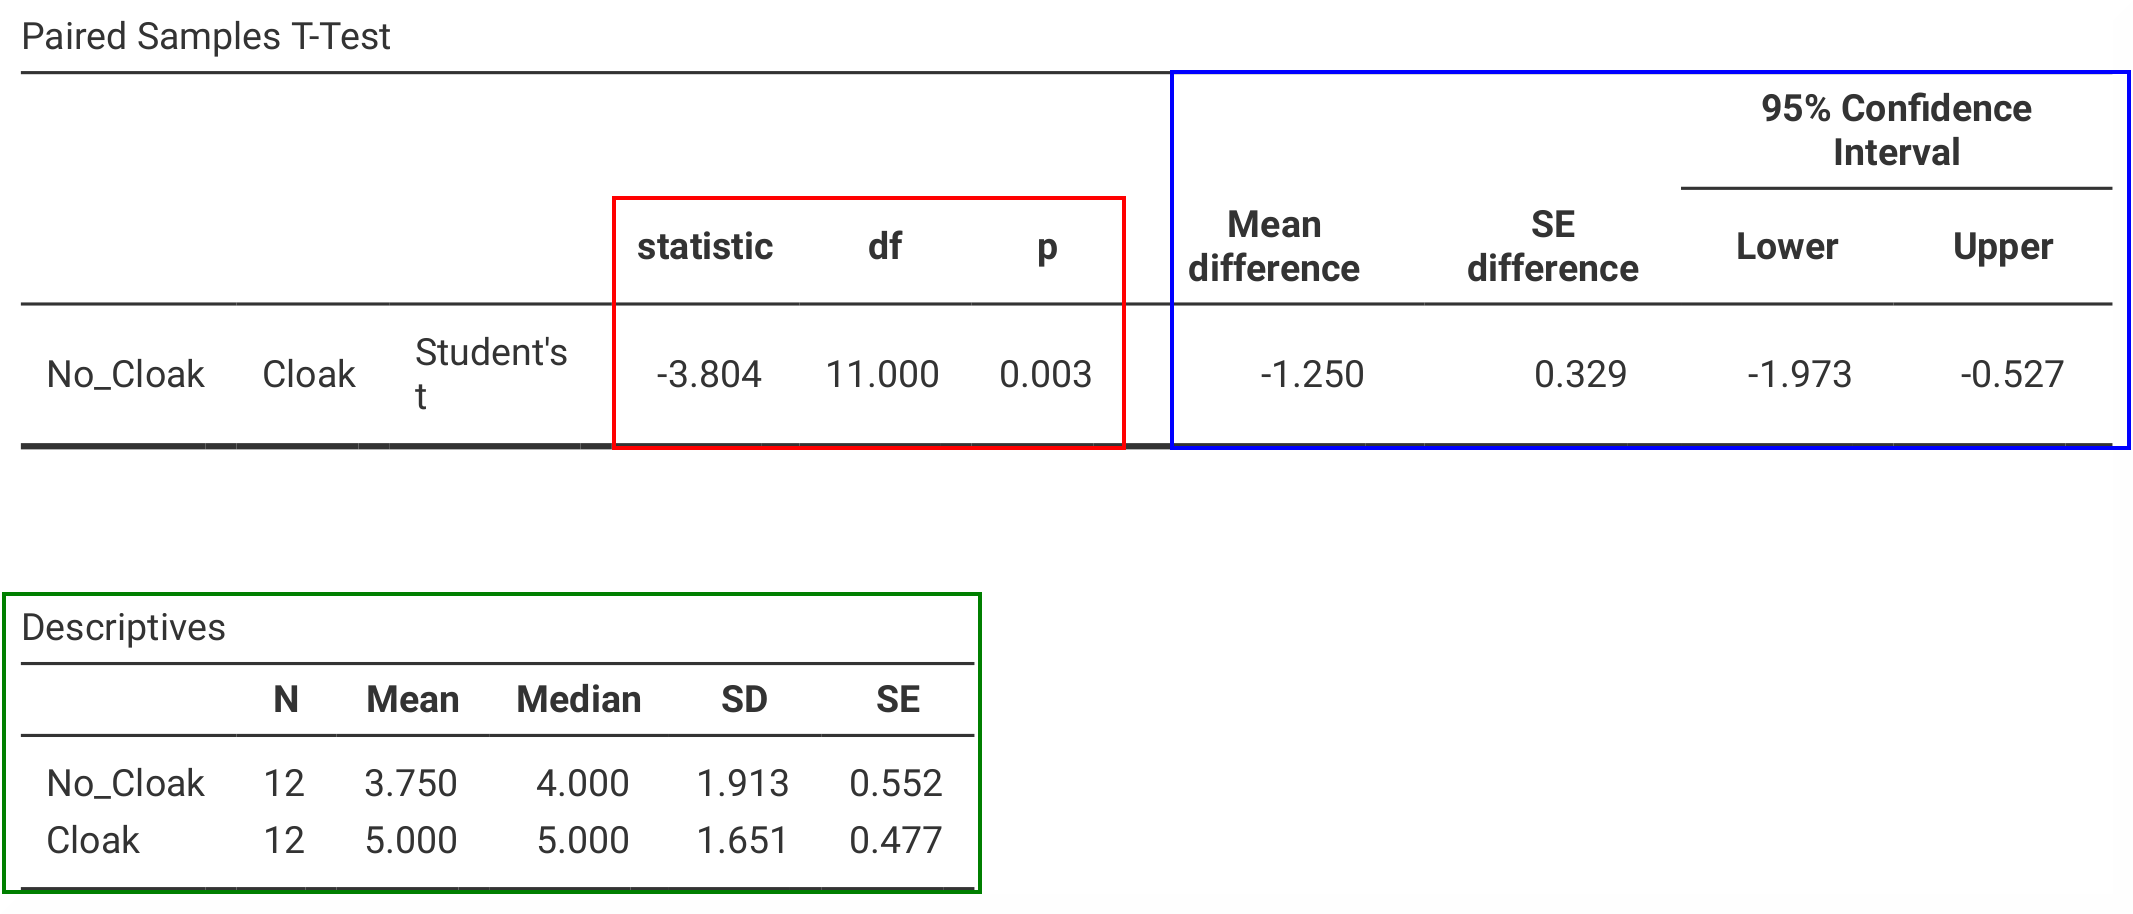
The results from SPSS and jamovi are identical, but they are arranged slightly differently. SPSS gives the mean difference (blue box) first, before giving
the t-statistics and their respective degrees of freedom and p-value (red box), in jamovi it is the other way round (statistics – red box – first and mean
difference – blue box – afterwards). Another table underneath (green box) gives the descriptive statistics for the two variables that were compared. Except
from that jamovi also reports the Median, and a slightly different way to arrange the columns (SPSS begins with the |
|
|
|
SPSS, in addition, gives the |
|
If one wishes to use syntax for running those analyses, this can be done using the following commands (in jamovi with just copying to code below to Rj). |
|
T-TEST PAIRS=No_Cloak WITH Cloak (PAIRED)
  /CRITERIA=CI(.95)
  /MISSING=ANALYSIS.
|
jmv::ttestPS(
    data = data,
    pairs = list(
        list(
            i1="No_Cloak",
            i2="Cloak")),
    meanDiff = TRUE,
    ci = TRUE,
    desc = TRUE)
|