Section author: Sebastian Jentschke
Rj Editor for jamovi
Preparation
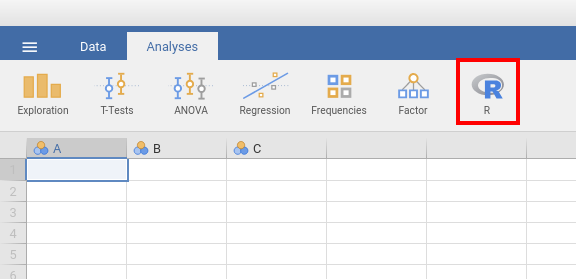
First you have to install the module Rj from the jamovi library. This will create a «R»-icon in the icon bar.
Running R commands
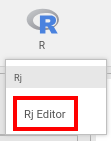
Click on the «R» icon and select «Rj Editor».
|
This opens an input field on the left side where you can use R commands.
|
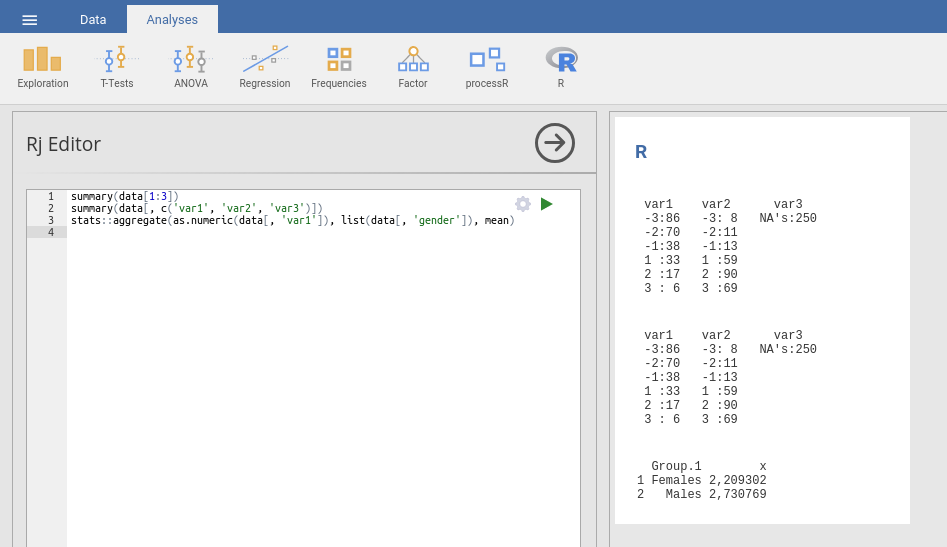
You can access your dataset with the variable data. The first line selects
the first three columns of your dataset. Alternatively, you can use variable
names as shown in the second line.
summary(data[1:3]) summary(data[, c(‘var1’, ‘var2’, ‘var3’)])
But you can also use functions from R libraries:
stats::aggregate(as.numeric(data[, ‘var1’]), list(data[, ‘gender’]), mean)
It may take a bit of time to figure out how to use these functions, especially to discover, e.g., which format is required for the data matrices you use as input to functions (those may need to be converted to numbers with «as.numeric» or to a list with «list»). But once you managed that, you have unlimited access to (almost) any kind of statistical analysis you can imagine.
This is not at least because there come already a wealth of R libraries
installed with jamovi and Rj: abind, acepack, afex, arm,
assertthat, backports, base, base64enc, BayesFactor,
BDgraph, BH, bindr, bindrcpp, bitops, boot, ca,
car, carData, caTools, cellranger, checkmate, class,
cli, clipr, cluster, coda, codetools, colorspace,
compiler, contfrac, corpcor, crayon, curl, d3Network,
data.table, datasets, deSolve, digest, dplyr, ellipsis,
elliptic, emmeans, estimability, evaluate, evaluate,
exact2x2, exactci, fansi, fdrtool, forcats, foreign,
Formula, gdata, GGally, ggm, ggplot2, ggridges,
glasso, glue, gnm, GPArotation, gplots, graphics,
grDevices, grid, gridExtra, gtable, gtools, haven,
highr, Hmisc, hms, htmlTable, htmltools, htmlwidgets,
huge, hypergeo, igraph, jmv, jmvcore, jpeg,
jsonlite, KernSmooth, knitr, kutils, labeling, lattice,
latticeExtra, lavaan, lazyeval, lisrelToR, lme4,
lmerTest, lmtest, magrittr, maptools, markdown, MASS,
Matrix, matrixcalc, MatrixModels, methods, mgcv, mi,
mime, minqa, mnormt, multcomp, munsell, mvnormtest,
mvtnorm, nlme, nloptr, nnet, numDeriv, OpenMx,
openxlsx, parallel, pbapply, pbivnorm, pbkrtest,
pillar, pkgconfig, pkgconfig, plogr, plyr, PMCMR,
png, praise, prettyunits, progress, psych, purrr,
qgraph, quantreg, qvcalc, R6, RColorBrewer, Rcpp,
RcppArmadillo, RcppEigen, RCurl, readr, readxl, regsem,
relimp, rematch, reshape, reshape2, RInside, rio,
Rj, rjson, rlang, rockchalk, ROCR, rpart, rpf,
RProtoBuf, Rsolnp, rstudioapi, RUnit, sandwich, scales,
sem, semPlot, semTools, sp, SparseM, spatial,
splines, ssanv, StanHeaders, stats, stats4, stringi,
stringr, survival, tcltk, testthat, TH.data, tibble,
tidyselect, tools, truncnorm, utf8, utils, vcd,
vcdExtra, vctrs, viridis, viridisLite, whisker, withr,
xfun, XML, xtable, yaml, zeallot, zip, zoo.
Some of these libraries are especially interesting:
statsto get access to a wealth of statistical analyses (e.g.,stats::glmfor fitting Generalized Linear Models orstats:kmeansfor running k-means cluster analyses)lme4to calculate Linear, Generalized Linear, and Nonlinear mixed modellsMASSimplements analyses from Venables og Ripley’s famous book «Modern Applied Statistics with S» (which includes, e.e., linear discriminant analysisMASS::lda)lavaanto run a wide range of analyses with latent variables (incl. confirmatory factor analysis, structural equation modeling and latent growth curve models)BayesFactorto run several types of Bayes-analyses to complement your «classical» (frequentist) statistics (e.g. the Bayes-equivalent of the t-test; NB: it is of course easier to use the jamovi-module «jsq» for that)clusterto run several types of cluster analysesggplot2to produce (almost) any type of fancy figures you can imaginethere are also several of Hadley Wickham’s
tidyverselibraries included, e.g.,dplyr,stringrortidyselect
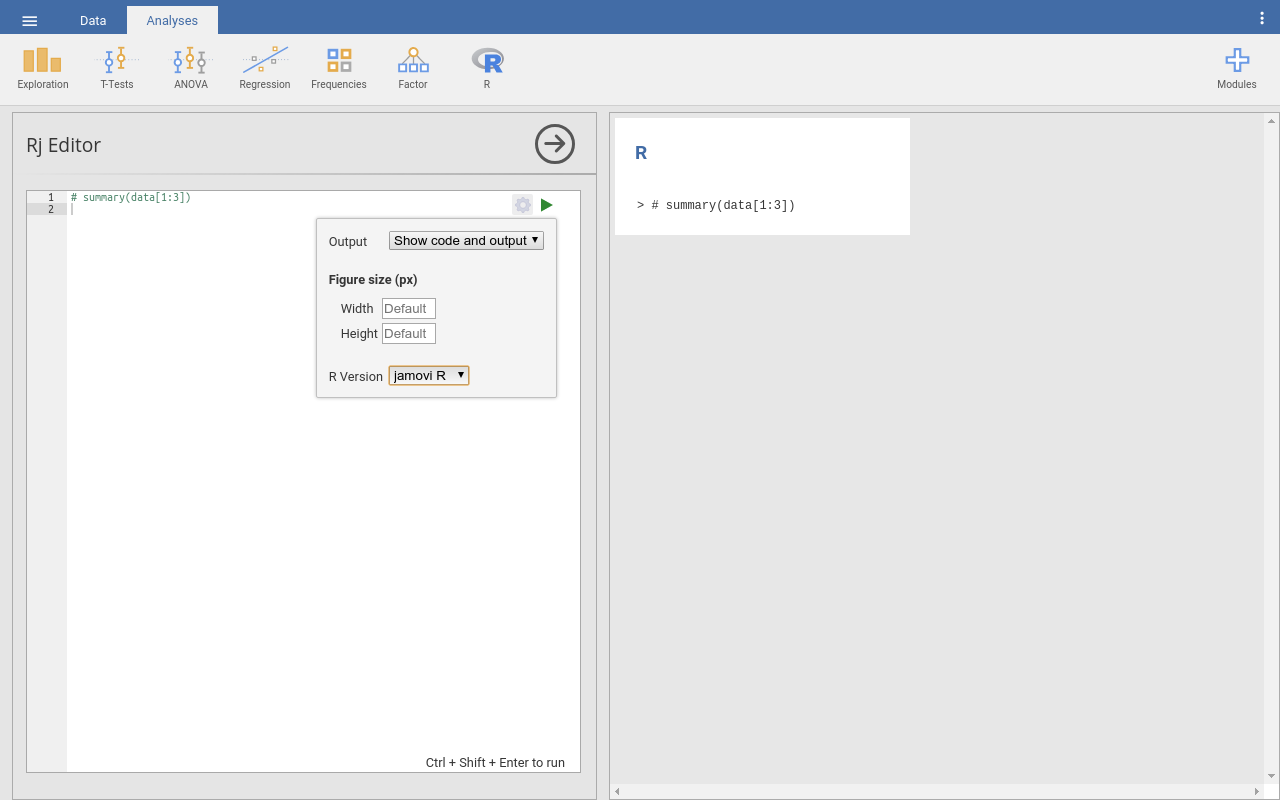
Switch between R-versions
|
Per default, Rj uses the R-installation that is included with jamovi. For most circumstances this will be sufficient (not the least because quite a wealth of libraries is included; see above). However, there might be occasions where you would like to use the R-installation on your computer; typically, if you want to use libraries that are not included in jamovi’s R-version. To do this, click on the cogwheel symbol in the top-right corner of the Rj-input field. A window opens where you can set whether you would like to use jamovi’s R version («jamovi R» in the dropdown box at the bottom) or your system’s R version («System R»). Please note that currently (Nov 2019), this option is not available for certain system-and-R-version-combinations (e.g., R > 3.4 on Linux). |