Section author: Jonas Rafi
Descriptives
How to perform descriptive analyses and create graphs in jamovi:
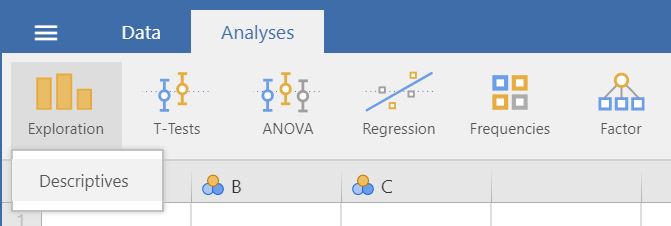
- Select
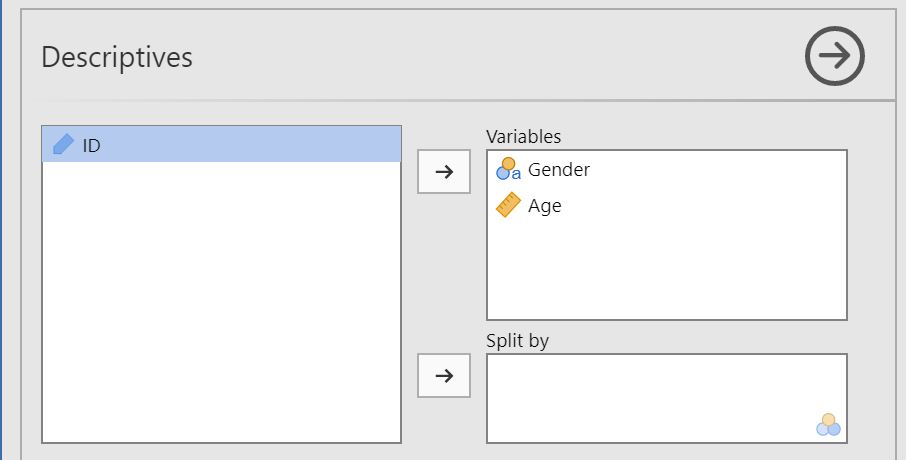
Analyses→Exploration→Descriptives. - Drag and drop the variables you want descriptive analyses for to
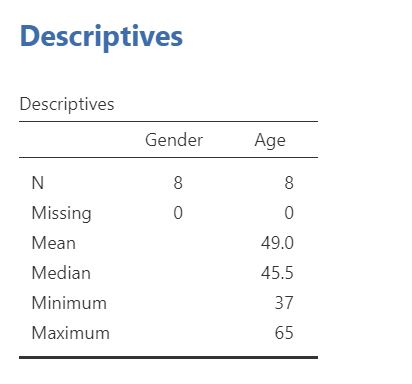
Variables. - The result is shown in the right panel. Right-click on the output to save or copy it.
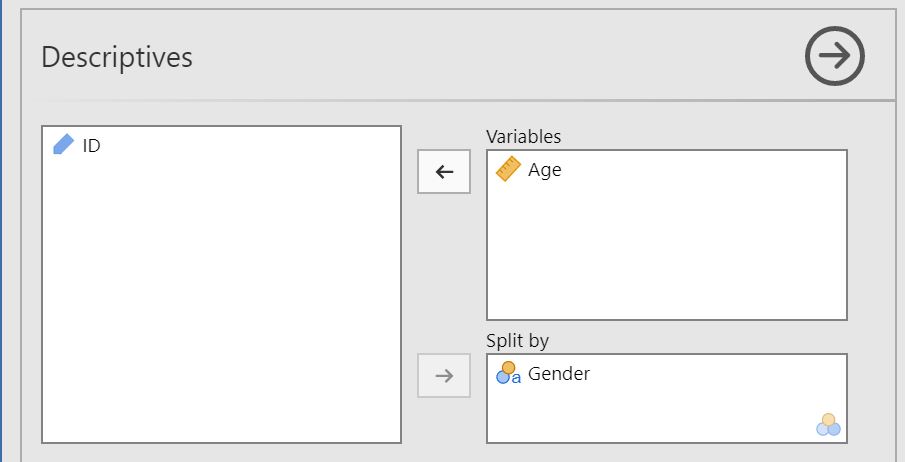
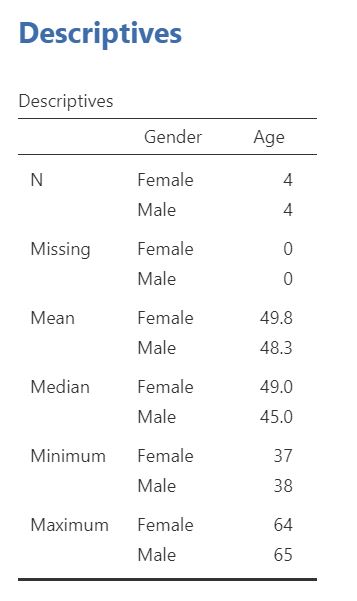
- To split your descriptive analyses on a categorical variable (e.g. to separate by gender), move that variable to
Split by.This changes how the output looks like: - Click the
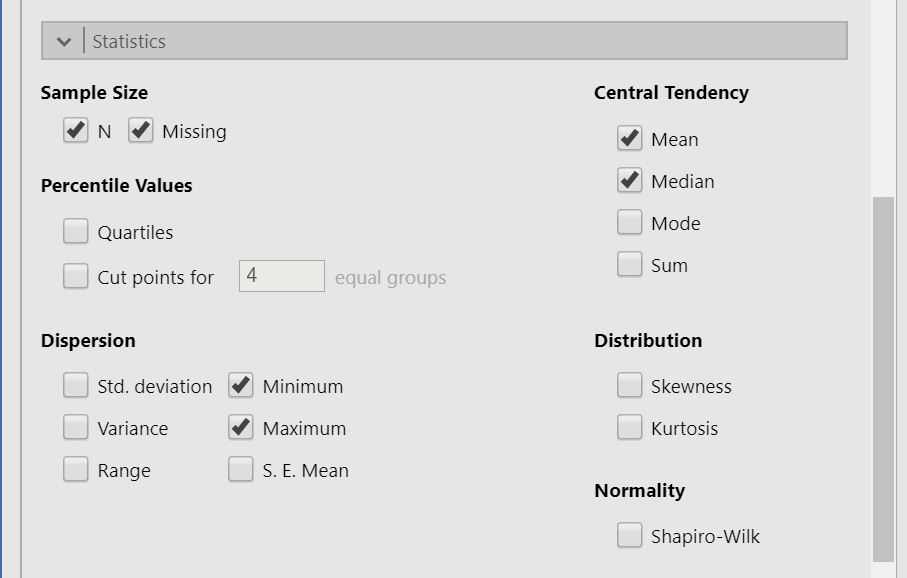
Statisticstab to see more alternatives. - To create a plot based on the above choices, click the
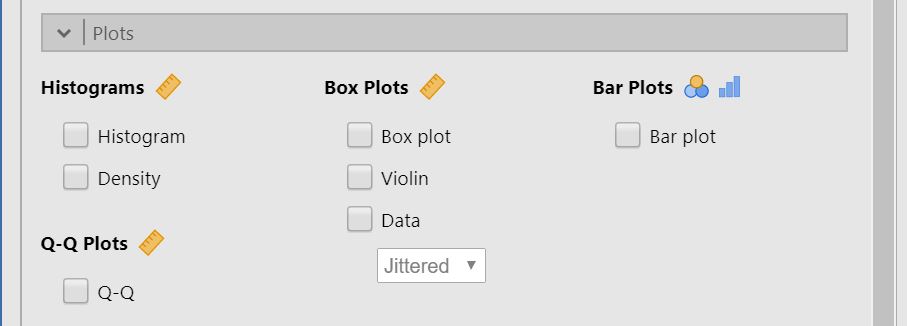
Plotstab and tick the box of your desired plot. If you would like to identify outliers and to check whehter your variables conform with a normal distribution, then you should tickBox plot,Violin, andQ-Q.
Further help from the community resources
If you would like to have these concepts explained in a different way,
please have a look at this introductory video
by Barton Poulson.
For those, aiming to stretch even further to an in-depth introduction, you
can read the respective chapter in the “Learning statistics with jamovi”
web documentation
or chapter 4 of the e-book
by Danielle J. Navarro and David R. Foxcroft.
