Section author: Jonathon Love
First steps in jamovi
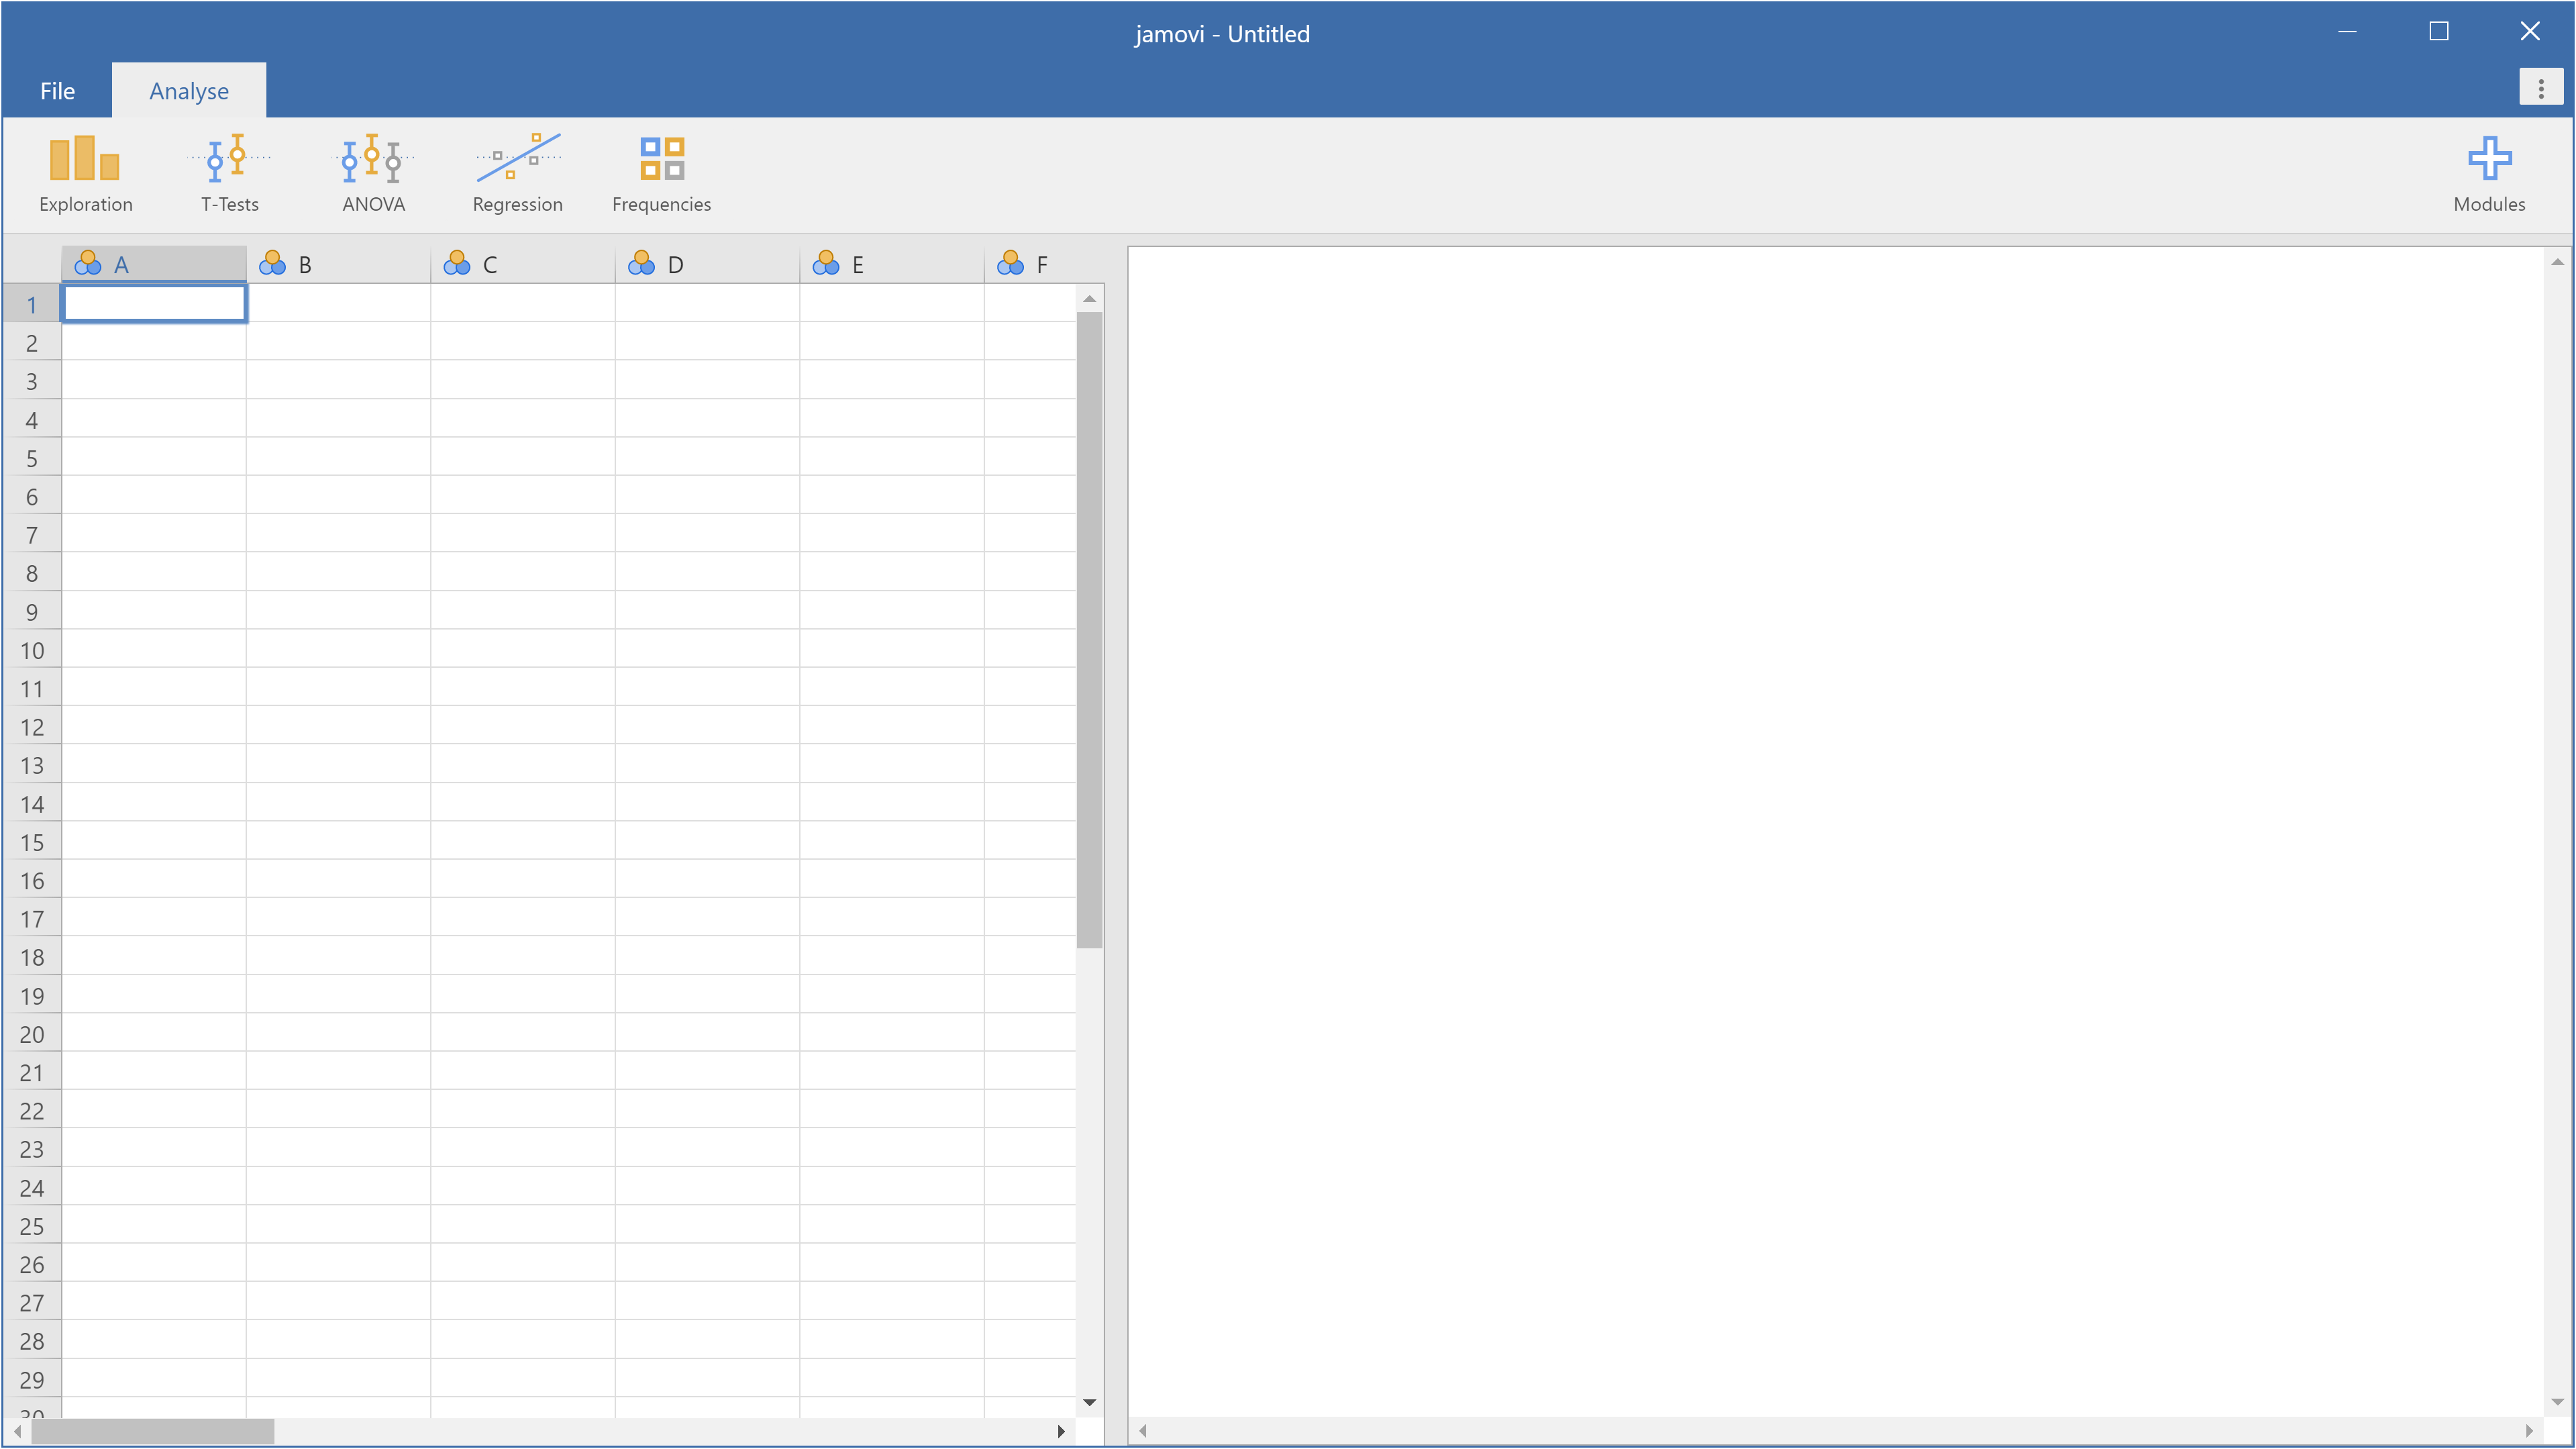
When first starting jamovi, you will be presented with a user interface which looks something like this.
To the left is the spreadsheet view, and to the right is where the results of statistical tests appear. Down the middle is a bar separating these two regions, and this can be dragged to the left or the right to change their sizes.
It is possible to simply begin typing values into the jamovi spreadsheet as you would any other spreadsheet software.
Alternatively, existing data sets in a range of formats (CSV, Excel, LibreOffice, R, SPSS, Stata, SAS, etc.) can be opened in jamovi. Additionally, there are a number of example data sets available in jamovi. To open a file, select the file menu (☰, at the top left hand corner of jamovi), select
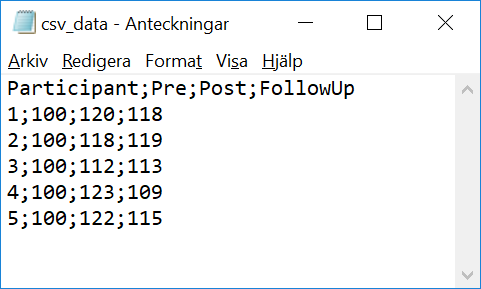
Openand thenData libraryorThis PC, depending on whether you want to open an example, or a file stored on your computer.A very common format for exchanging data is using files with “comma- separated values” (.csv or .txt). Given that these data are stored as simple text file using commas (or “;”, “|”, etc.) to separate values nearly any software package can read and write them (and you to can take a look using any text editor). An example is shown in the figure. The first line contains the variable names and any other line afterwards a measurement point (typically a person where data were acquired from). If you have your data in a spreadsheet program (e.g., Excel), you can create a CSV-file from your data by selecting
File→Save as...and chooseComma delimitedin the drop-down menu close to theSave as-button. Thereafter, you may open the CSV-file in jamovi.In the unlikely event that jamovi does not open a file correctly, file an issue (bug report) in the GitHub issue tracker.

