Section author: Sebastian Jentschke, Jonathon Love
The jmv R package
For some use-cases, it’s preferable to be able use the jamovi analyses from R. This is provided by the jmv R package.
Preparation
jmv is available from CRAN (a central repository for publicly available R-packages). To install jmv, open an interactive R session (e.g. RStudio) and type the first line (the >-mark at the begin of the line is the input-mark of R and must not be copied / typed). The package haven is required if you want to read or write SPSS, SAS or Stata files and can be installed using the second line. If you want to read and write jamovi’s omv-files you can use the package jmvReadWrite which is installed using the third line. Finally, the package jmvconnect permits to access data sets that you currently have opened in jamovi.More information about the analyses
jmv provides or how to use the other packages is available using the R help system, or from the overview below.install.packages('jmv')
install.packages('haven')
install.packages('jmvReadWrite')
install.packages('jmvconnect')
Use of jamovi syntax in R
For examples on how to use
jmv, jamovi can be placed in ‘Syntax mode’.
Syntax mode produces the R syntax required to reproduce jamovi analyses in R.
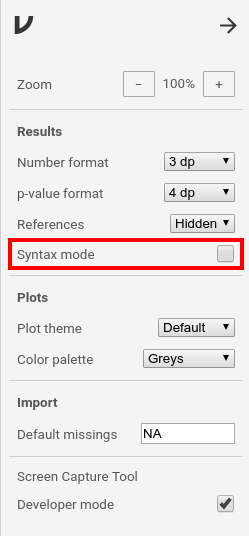
To enable the syntax mode, you have to click the properties icon (⋮) in the
top-right corner. Set a tick at syntax mode in the properties window.Close the properties with the arrow-icon (→) at the top-right.
|
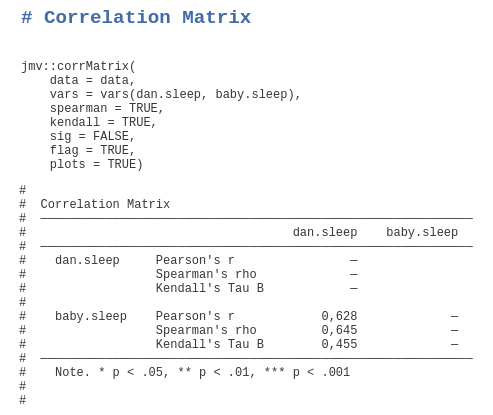
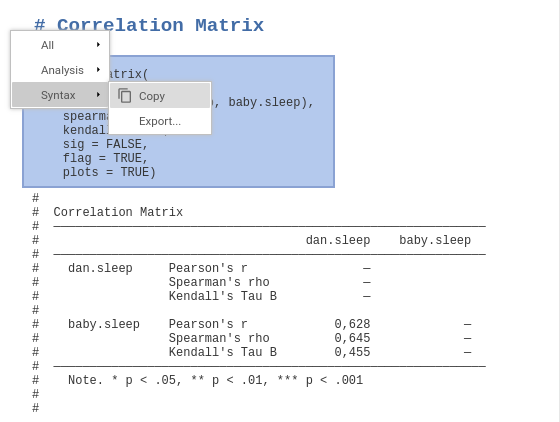
The main window changes to text mode and you can run analyses and afterwards right-click on the command the appears at the top of each analysis to export or copy the syntax.
|
Alternatively, you can write syntax directly. To do this, open R or RStudio
and type the command in the first line. As during the description of the
installation above, the second line is required if you want to use SPSS / SAS
/ Stata files, the third line for reading jamovi-files, and the fourth line
for directly accessing datasets opened in your current jamovi-session.
library(jmv)

library(haven)
library(jmvReadWrite)
library(jmvconnect)
Afterwards, you are ready to analyze your data. Typically, you have to load a
dataset first. Use the first line if you have a CSV file (
sep has to be
set to the separator between data cells, e.g., ,, ;, etc.), the
second line for loading SPSS-files, or the third line for loading
jamovi-files:data = read.csv("data.csv", header = TRUE, sep = ",")
data = haven::read_sav("data.sav")
data = jmvReadWrite::read_omv("data.omv")
Afterwards are you ready to run whatever analysis you like (here is an
overview of available functions). For
example, to run a simple descriptive-statistics-analysis:
jmv::descriptives(data = data, vars = vars(var1, var2))
or for a correlation between to variables (quite basic in the first and more
advanced - adding two non-parametric measures and plots - in the second line;
please note that pearson = TRUE is not necessary because it is the default):
jmv::corrMatrix(data = data, vars = vars(var1, var2), pearson = TRUE, sig = TRUE)
jmv::corrMatrix(data = data, vars = vars(var1, var2), spearman = TRUE, kendall = TRUE, sig = FALSE, flag = TRUE, plots = TRUE)