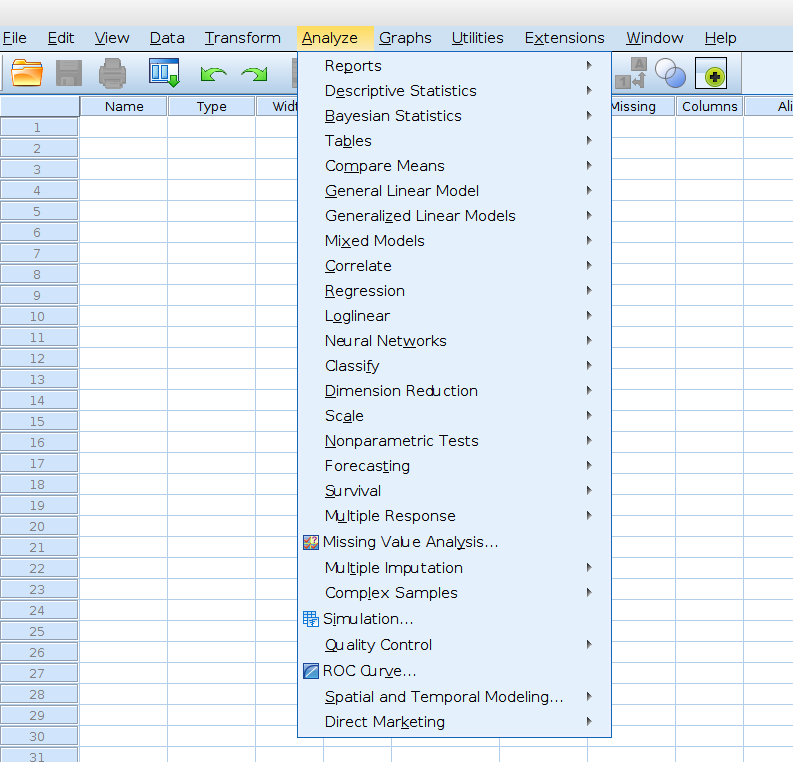
Comparison of analyses available in SPSS and jamovi
SPSS (version 27)
The overview covers functions from SPSS Base (99$) and Advanced (79 US$), i.e. 178 US$ / user and month.
|
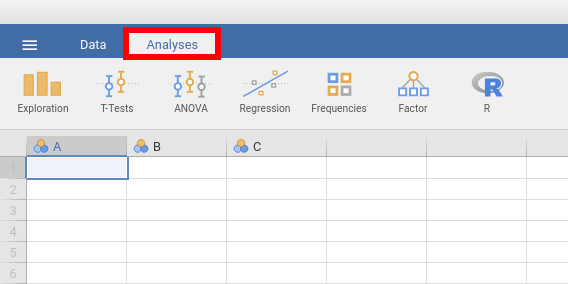
jamovi (versjon 2.0) |
|
Already at first glance, it
becomes clear that jamovi
currently has fewer features than
SPSS. But:
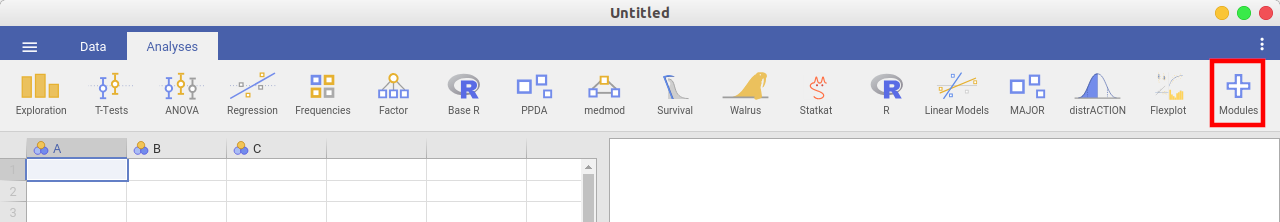
(1) There is a (ever increasing)
made available via modules (press
the “+” sign in the right upper
corner of the jamovi window to add
them) and
(2) The features implemented
already cover “standard” needs
(90% of the most common analyses
used in psychology).
Feel free to check out which
modules are available: There is
also quite a wealth of modules
covering functions that are not
available in SPSS but very useful
(e.g., for meta-analyses; MAJOR).
If you are willing to use some R
code (e.g., in conjunction with
the jamovi-module Rj) then you can
(most presumably) do every
analysis you could imagine.
|
Reports |
|
Reports → Codebook |
N/A |
Reports → OLAP Cubes |
N/A |
Reports → Case summaries |
Exploration → Descriptives has the same functionality |
Reports → Reports Summaries in Rows |
N/A |
Reports → Reports Summaries in Columns |
N/A |
Descriptive Statistics |
|
Descriptive Statistics → Frequencies |
Exploration → Descriptives combines all three procedures tick «Frequency tables» to get an output that is similar to that of «Frequencies» in SPSS |
Descriptive Statistics → Descriptives |
|
Descriptive Statistics → Explore |
|
Descriptive Statistics → Crosstabs |
Frequencies → (Contingency tables) → Independent samples |
Descriptive Statistics → Ratio |
N/A |
Bayesian Statistics |
|
requires the jamovi-module «jsq» |
|
Bayesian Statistics → One Sample Normal |
T-Test → Bayesian One Sample T-Test |
Bayesian Statistics → One Sample Binomial |
Frequencies → Bayesian Proportion Test |
Bayesian Statistics → One Sample Poisson |
Frequencies → Bayesian Contingency Tables |
Bayesian Statistics → Related Sample Normal |
T-Test → Bayesian Paired Samples T-Test |
Bayesian Statistics → Independent Samples Normal |
T-Test → Bayesian Independent Samples T-Test |
Bayesian Statistics → Pearson Correlation |
Regression → Bayesian Correlation Matrix / Bayesian Correlation Pairs |
Bayesian Statistics → Linear Regression |
Regression → Bayesian Linear Regression |
Bayesian Statistics → One-way ANOVA |
ANOVA → Bayesian ANOVA (can handle several factors while SPSS is limited to one factor) |
Bayesian Statistics → Log-Linear Models |
Frequencies → Bayesian Log-Linear Regression |
Compare Means |
|
Compare Means → Means… |
Exploration → Descriptives replaces / integrates that functionality, choose the drop-down menu «Statistics» and set ticks at «Mean», «N» and «Std. deviation» |
Compare Means → Independent-Samples T Test |
T-Test → Independent Samples T-Test |
Compare Means → Paired-Samples T Test |
T-Test → Paired Samples T-Test |
Compare Means → One-Sample T Test |
T-Test → One Sample T-Test |
Compare Means → One-Way ANOVA |
ANOVA → One-Way ANOVA |
General Linear Model |
|
General Linear Model → Univariate |
ANOVA → One-Way ANOVA |
General Linear Model → Multivariate |
ANOVA → MANCOVA |
General Linear Model → Repeated Measures |
ANOVA → Repeated Measures ANOVA |
General Linear Model → Variance Components |
N/A |
Generalized Linear Models |
|
requires the jamovi-module «GAMLj» (General Analyses for the Linear Model in jamovi) |
|
Generalized Linear Models → Generalized Linear Models |
|
Generalized Linear Models → Generalized Estimating Equations |
|
Mixed Models |
|
requires the jamovi-module «GAMLj» (General Analyses for the Linear Model in jamovi) |
|
Mixed Models → Linear |
|
Mixed Models → Generalized Linear |
|
Correlate |
|
Correlate → Bivariate |
Regression → Correlation Matrix |
Correlate → Partial |
Regression → Partial Correlation |
Correlate → Distances |
N/A |
Regression |
|
Regression → Automatic Linear Models |
N/A |
Regression → Linear |
Regression → Linear Regression |
Regression → Ordinal |
Regression → (Logistic Regression) → Ordinal Outcomes |
Regression → Curve Estimation |
|
Regression → Partial Least Squares |
|
Loglinear |
|
Loglinear → General |
Frequencies → Log-Linear Regression |
Loglinear → Logit |
|
Loglinear → Model Selection |
|
Classify |
|
Classify → Nearest Neighbor |
N/A |
Classify → Discriminant |
N/A, can be calculated using R-code and the R-library «MASS» |
Classify → TwoStep Cluster |
N/A |
Classify → Hierarchical Cluster |
N/A, can be calculated using R-code and the R-library «pvclust» |
Classify → K-Means Cluster |
|
Dimension Reduction |
|
Dimension Reduction → Factor |
Factor → (Data reduction) →
Principal Component Analysis
Factor → (Data reduction) →
Exploratory Factor Analysis 1
|
Scale |
|
Scale → Reliability Analysis |
Factor → (Scale analysis) → Reliability analysis |
Scale → Multidimensional Scaling |
N/A |
Nonparametric Tests |
|
Nonparametric Tests → One Sample |
N/A, the tests itself are available (see below), but not a common start menu that allows a selection based on your data (e.g., between- or within-subject) |
Nonparametric Tests → Independent Samples |
|
Nonparametric Tests → Related Samples |
|
Nonparametric Tests → Legacy Dialogs → Chi-Square |
Frequencies → (One Sample Proportion Tests) → N Outcomes (x² goodness of fit) |
Nonparametric Tests → Legacy Dialogs → Binomial |
Frequencies → (One Sample Proportion Tests) → 2 Outcomes (Binomial test) |
Nonparametric Tests → Legacy Dialogs → Runs |
N/A |
Nonparametric Tests → Legacy Dialogs → 1-Sample K-S |
N/A, Shapiro-Wilks available under Exploration → Descriptives, choose drop-down menu «Statistics» and tick «Shapiro-Wilks» |
Nonparametric Tests → Legacy Dialogs → 2 Independent Samples |
T-Test → Independent Samples T-Test, set tick-box «Mann-Whitney U» |
Nonparametric Tests → Legacy Dialogs → 2 Related Samples |
T-Test → Paired Samples T-Test, set tick-box «Wilcoxon Rank» |
Nonparametric Tests → Legacy Dialogs → K Independent Samples |
ANOVA → (Non-Parametric) → One-Way ANOVA (Kruskal-Wallis) |
Nonparametric Tests → Legacy Dialogs → K Related Samples |
ANOVA → (Non-Parametric) → Repeated Measures ANOVA (Friedman) |
Survival |
|
requires the jamovi-module «Death watch» |
|
Survival → Life Tables |
|
Survival → Kaplan-Meier |
|
Survival → Cox Regression |
|
Survival → Cox w/ Time-Dep Cov |
|
Multiple Response |
|
Multiple Response → Define Variable Sets |
N/A |
Multiple Response → Frequencies |
|
Multiple Response → Crosstabs |
|
ROC Curve |
|
ROC Curve |
N/A, accessible via R packages (e.g., ROCR eller pROC) |
Simulation |
|
Simulation |
N/A |
Spatial and Temporal Modeling |
|
Spatial and Temporal Modeling → Spatial Modeling |
N/A |
- 1
Whereas SPSS puts both methods into one procedure (
FACTOR) makes jamovi a conceptual difference between Principal Component Analysis aiming at data reduction (i.e., reducing the number of dimension that are required to describe the data) and Exploratory Factor Analysis aiming at extracting underlying latent variables.